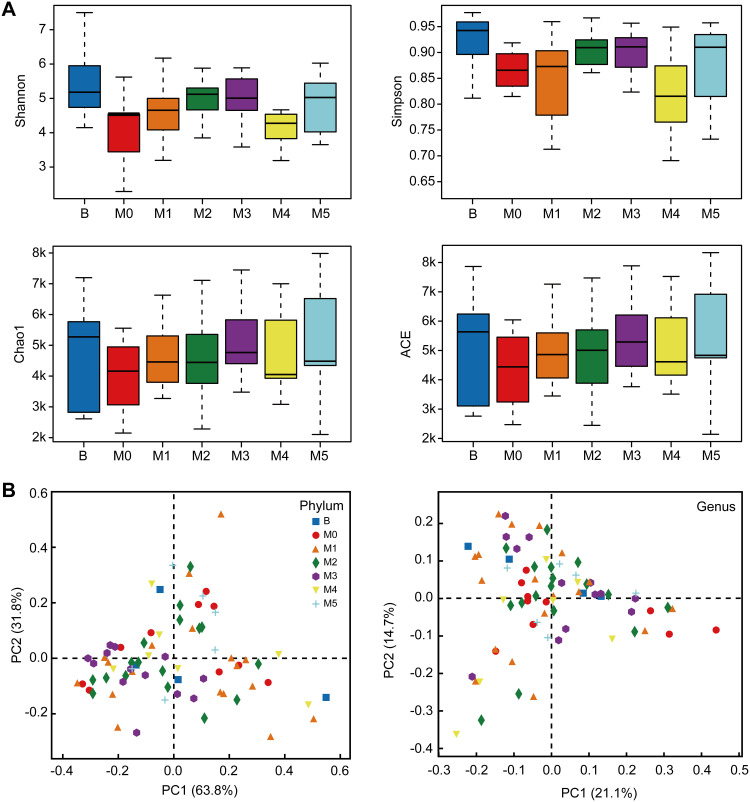
Figure 1.
Alpha and beta diversity of bacterial populations in preoperative Group B, pre-chemotherapy Group M0 and groups M1–5 during stages of chemotherapy. (A) Boxplots of observed OTUs (≥97% identity level), Shannon index, Simpson index, Chao1 estimator richness and ACE values of the fecal samples in seven groups. (B) PCoA plots obtained from sequencing the microbial in fecal samples.

