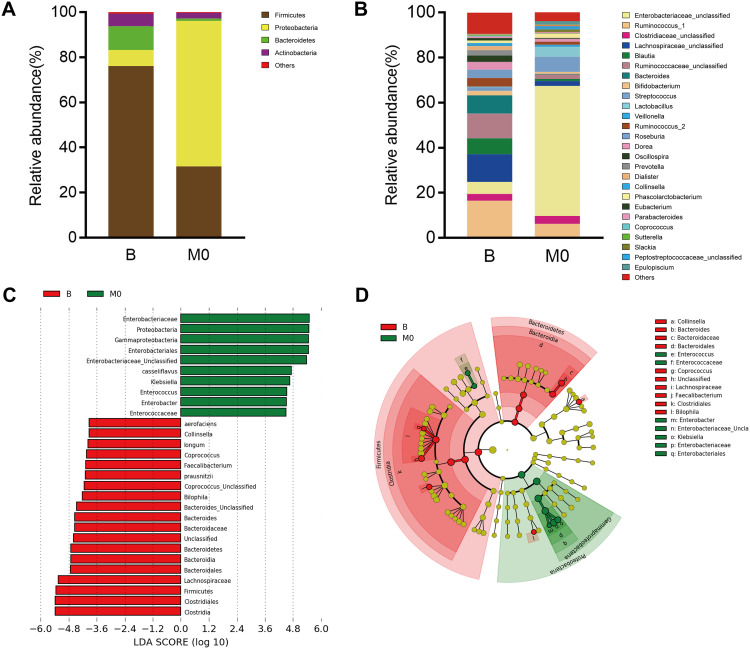
Figure 2.
Comparison of intestinal microbiota between preoperative (Group B) and postoperative (Group M0) ovarian cancer patients. Relative abundance of the dominant phyla (A) and genera (B) in these two groups. (C) Histogram of linear discriminant analysis (LDA) scores for differentially abundant genera. (D) Cladogram of LDA coupled with effective size measurement showing differentially abundant genera.

