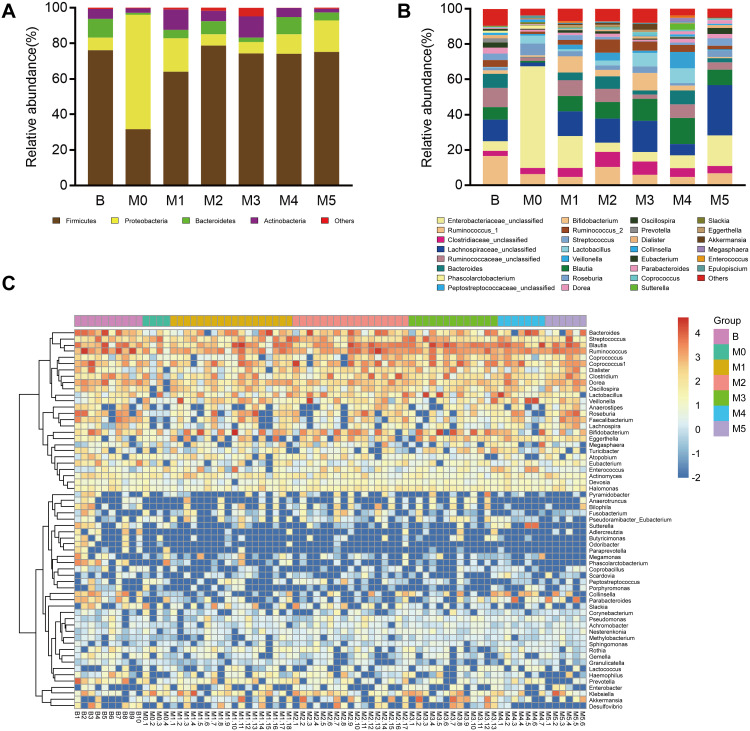
Figure 3.
Comparison of intestinal microbiota among preoperative Group B, postoperative Group M0 and groups M1–5 during stages of chemotherapy. Relative abundance of the dominant phyla (A) and genera (B) in the seven groups. (C) Heat map analysis of the bacterial distribution based on hierarchical clustering of the 75 fecal samples in preoperative Group B, postoperative Group M0 and groups M1–5.

