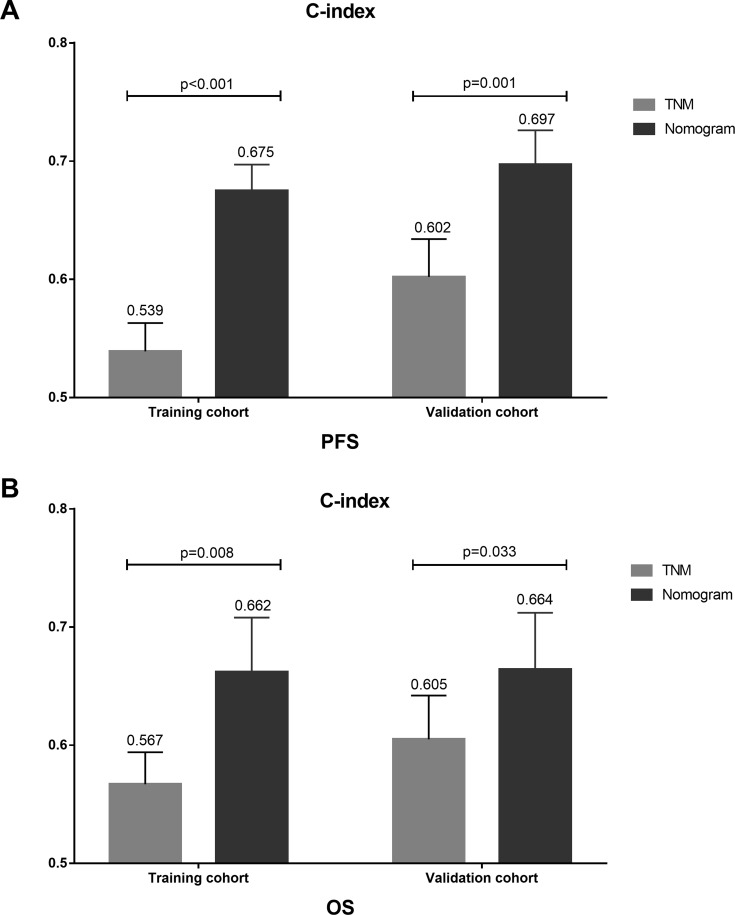
Figure 6.
The comparison of c-index of TNM and nomogram for PFS and OS in training cohort and validation cohort, respectively. (A) The c-index of TNM and nomogram for PFS in training cohort (0.539 vs. 0.675, p < 0.001) and validation cohort (0.602 vs. 0.697, p = 0.001). (B) The c-index of TNM and nomogram for OS in training cohort (0.567 vs. 0.662, p = 0.009) and validation cohort (0.605 vs. 0.664, p = 0.033).
Abbreviations: PFS, progression-free survival; OS, overall survival.

