. 2020 Feb 20;1(1):68–81. doi: 10.1158/0008-5472.BCD-19-0068

Figure 5.

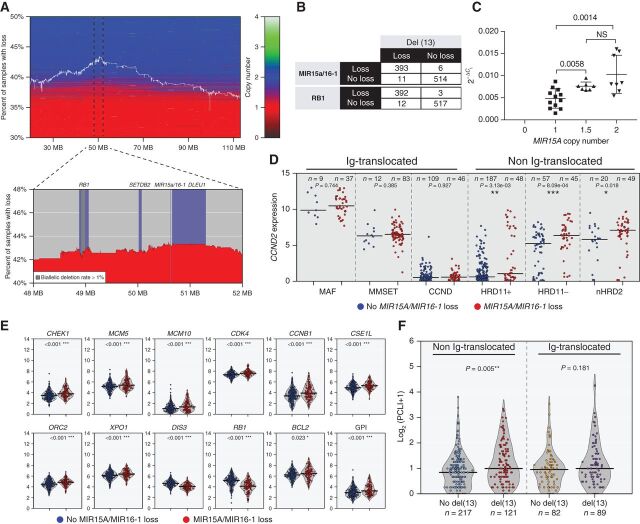
Figure 5. MIR15A/MIR16-1 monosomy is associated with increased proliferation in non-Ig–translocated NDMM. A, Investigation of CoMMpass NDMM copy number levels of chromosome 13 show region surrounding MIR15A/MIR16-1 to be the most frequently lost. The white line indicates the percentage of all cases with a loss at specific locations along chromosome 13 where horizontal shading reproduces segmentation data for each patient sorted vertically according to the percentage of total loss of chromosome 13. B, Distribution of NDMM cases with or without copy number loss of MIR15A/16-1 or RB1 relative to presence or absence of del(13). C, Relative expression of MIR15a (normalized to U6 snRNA) in multiple myeloma cell lines relative to MIR15A copy number. Each dot represents the average MIR15A value calculated by TaqMan assay using the 2−ΔCt method from triplicate assays for each cell line tested. P values for nonparametric t test are shown. D, Log2-transformed TPM data for NDMM reveal increased CCND2 expression in non-Ig-translocated cases with loss of MIR15A/MIR16-1. E, Increased expression of proliferation targets (CHEK1, MCM5, MCM10, CDK4, and CCNB1), DNA replication (ORC2), nuclear transport (XPO1 and CSE1L), and antiapoptotic (BCL2) genes for NDMM non-Ig–translocated cases with loss of MIR15A/MIR16-1, resulting in overall increase in GPI. In addition, expression of markers on chromosome 13 (DIS3, RB1) shows copy number dependency. The number of patients within each group and Wilcoxon P values for each comparison are shown for D and E. F, Plasma cell labeling index calculated by flow cytometry in clonal PCs collected at the time of diagnosis in the indicated subgroups, divided into Ig-translocated and not translocated, with or without del(13) according to FISH analysis. The number of patients within each group and Wilcoxon P values for each comparison are shown.

MIR15A/MIR16-1 monosomy is associated with increased proliferation in non-Ig–translocated NDMM. A, Investigation of CoMMpass NDMM copy number levels of chromosome 13 show region surrounding MIR15A/MIR16-1 to be the most frequently lost. The white line indicates the percentage of all cases with a loss at specific locations along chromosome 13 where horizontal shading reproduces segmentation data for each patient sorted vertically according to the percentage of total loss of chromosome 13. B, Distribution of NDMM cases with or without copy number loss of MIR15A/16-1 or RB1 relative to presence or absence of del(13). C, Relative expression of MIR15a (normalized to U6 snRNA) in multiple myeloma cell lines relative to MIR15A copy number. Each dot represents the average MIR15A value calculated by TaqMan assay using the 2−ΔCt method from triplicate assays for each cell line tested. P values for nonparametric t test are shown. D, Log2-transformed TPM data for NDMM reveal increased CCND2 expression in non-Ig-translocated cases with loss of MIR15A/MIR16-1. E, Increased expression of proliferation targets (CHEK1, MCM5, MCM10, CDK4, and CCNB1), DNA replication (ORC2), nuclear transport (XPO1 and CSE1L), and antiapoptotic (BCL2) genes for NDMM non-Ig–translocated cases with loss of MIR15A/MIR16-1, resulting in overall increase in GPI. In addition, expression of markers on chromosome 13 (DIS3, RB1) shows copy number dependency. The number of patients within each group and Wilcoxon P values for each comparison are shown for D and E. F, Plasma cell labeling index calculated by flow cytometry in clonal PCs collected at the time of diagnosis in the indicated subgroups, divided into Ig-translocated and not translocated, with or without del(13) according to FISH analysis. The number of patients within each group and Wilcoxon P values for each comparison are shown.