
Figure 1.
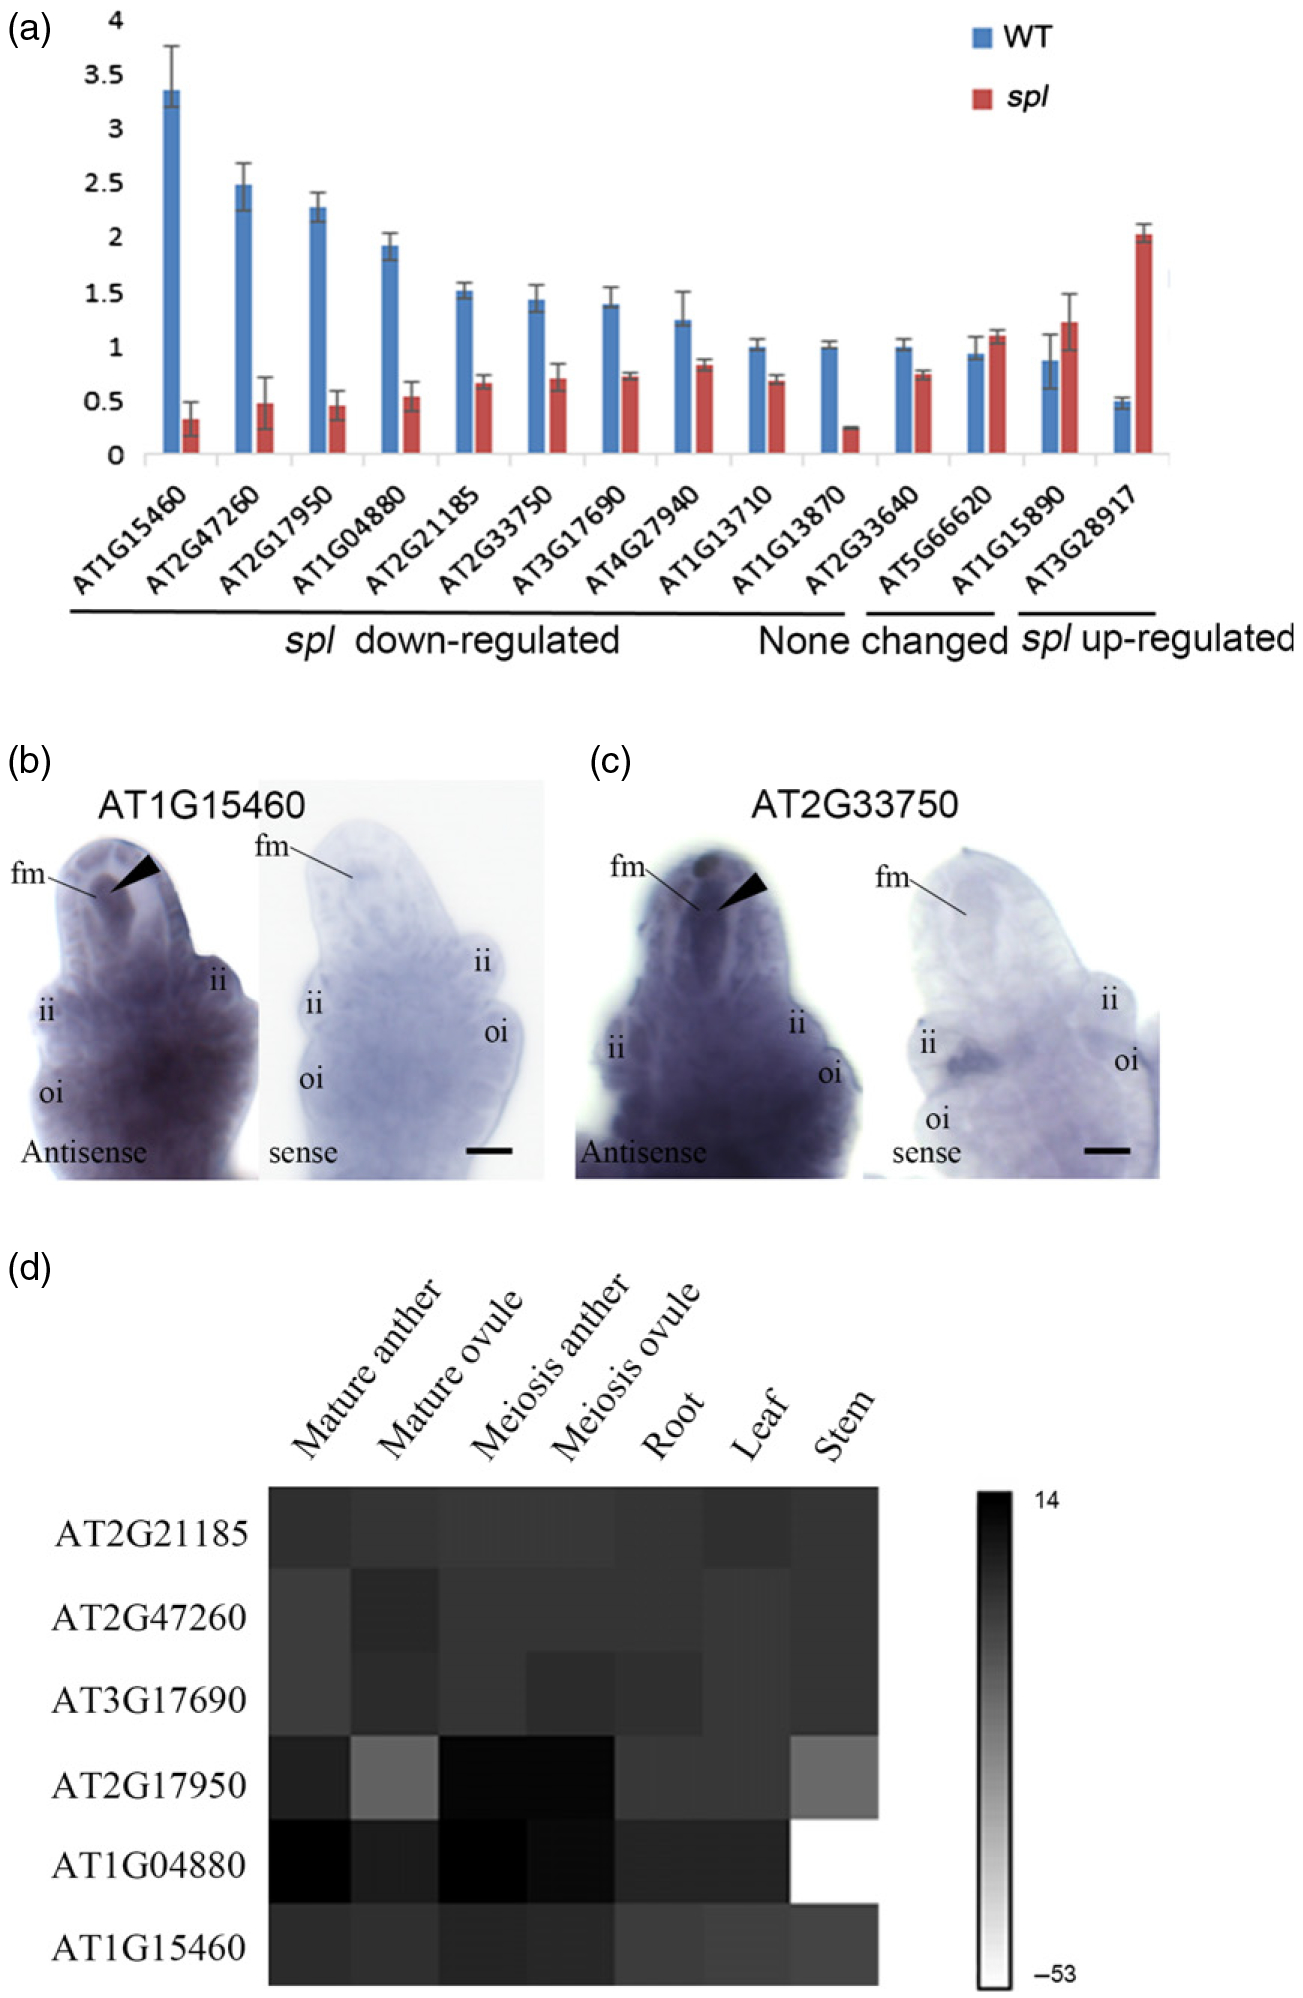
Validation of sequencing results by real-time PCR and in situ hybridization.
(a) Transcript levels of 14 genes in wild-type (WT) and spl ovules. Transcript levels were measured by qRT-PCR and normalized to HK2. Each value represents the mean of two biological replicates and two technical replicates. Error bars represent standard deviation.
(b) Whole-mount in situ hybridization of At1g15460.
(c) Whole-mount in situ hybridization of At2 g33750. Arrowheads point to the enriched expression pattern in the female meioctye (fm). Scale bars: 10 μm. Abbreviations: ii, inner integument; oi, outer integument.
(d) Heat map of the relative expression levels of six FM genes in different tissues measured by qRT-PCR. Colors are scaled by log2-transformed mean expression values from two biological replicates and two technical replicates. Black denotes high expression and white denotes low expression.