
Figure.
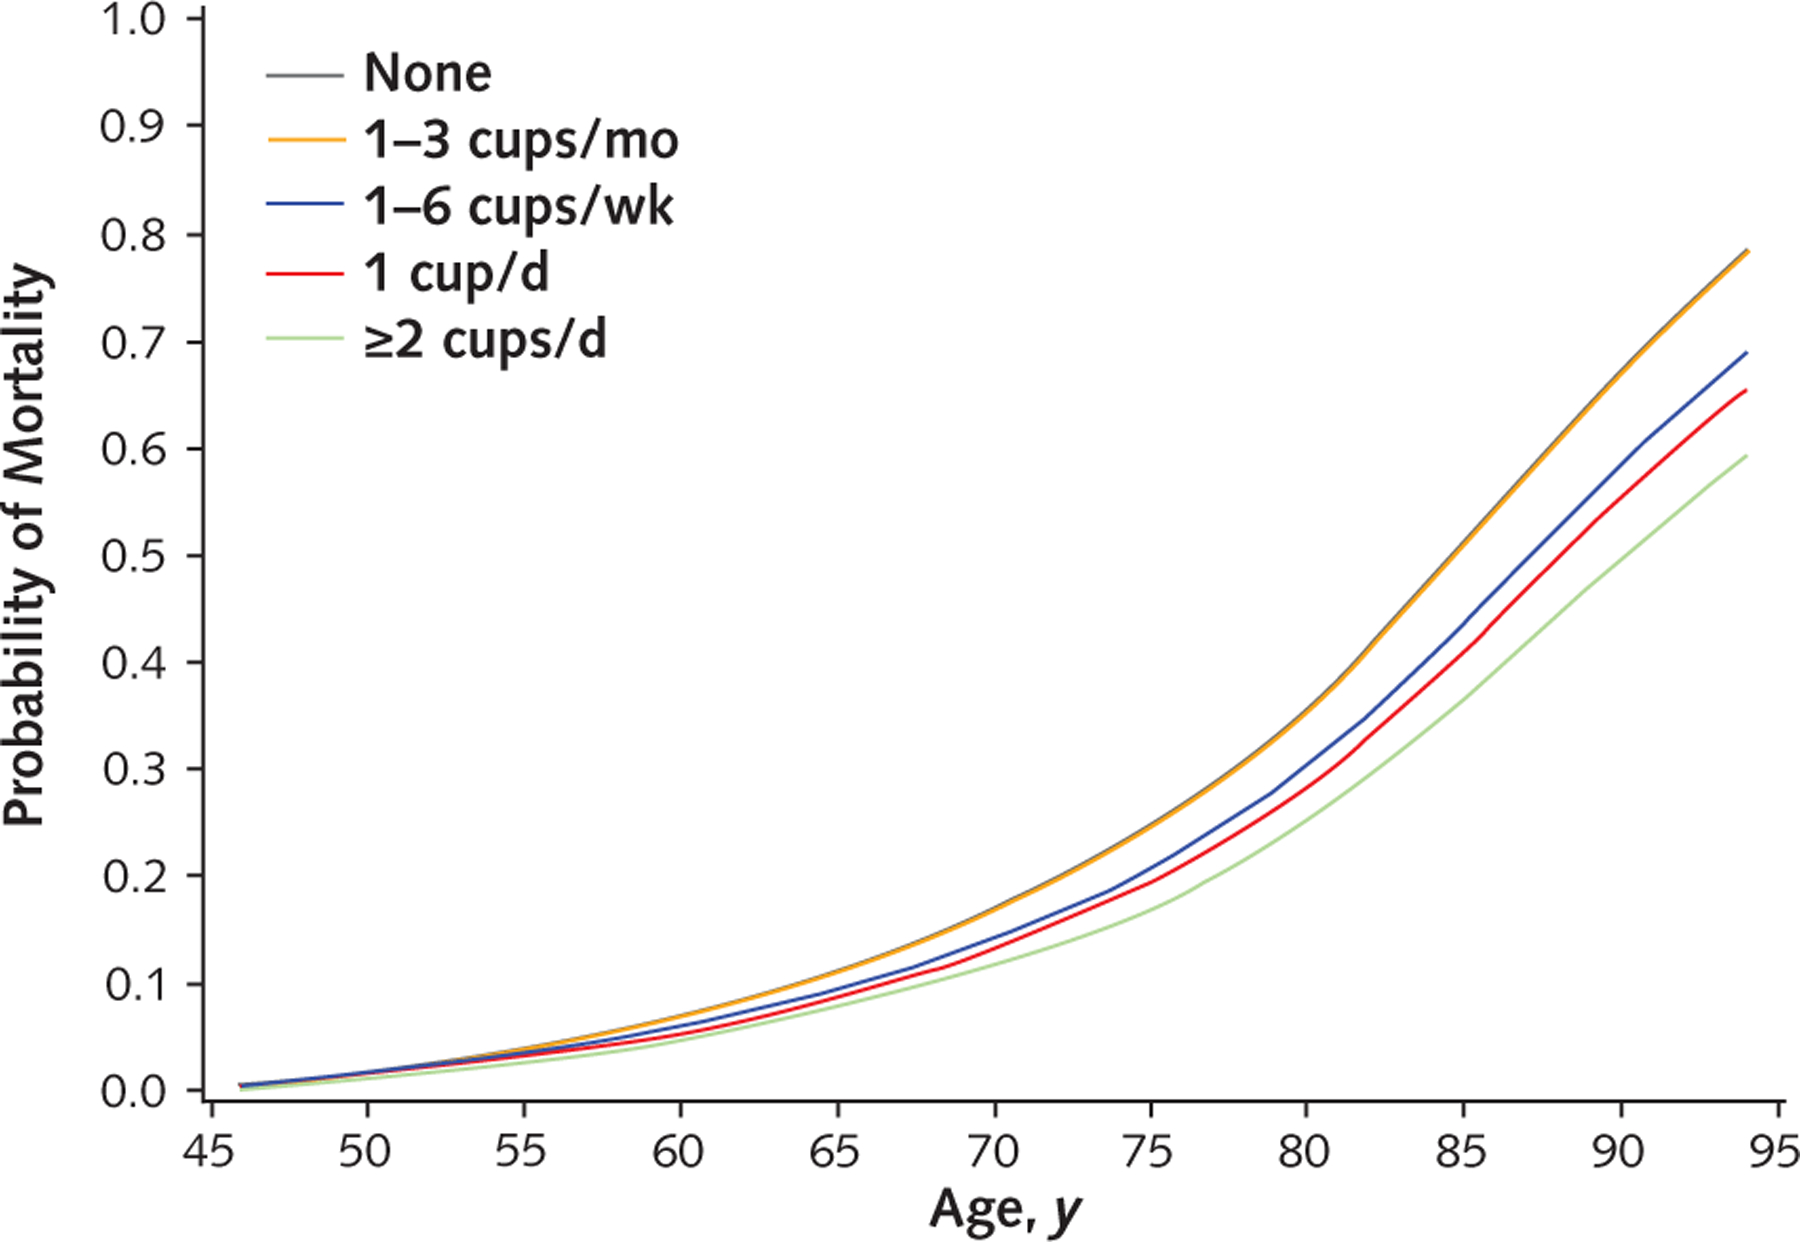
Adjusted mortality in the Multiethnic Cohort, by age by category of coffee consumption, 1993–2012. Direct adjusted curves were generated using the Cox model as the average of the model-based curves at observed profiles for the following covariates: age at cohort entry, sex, ethnicity, smoking variables (smoking status; average number of cigarettes; squared average number of cigarettes; number of years smoking [time-dependent]; number of years since quitting [time-dependent]; and interactions between ethnicity and smoking status, average number of cigarettes, squared average number of cigarettes, and number of years smoking), body mass index, education, physical activity, alcohol consumption, total energy intake, energy from fat, and preexisting illness. For categorical covariates, dummy variables were used. The “None” and “1–3 cups/ mo” lines overlap.