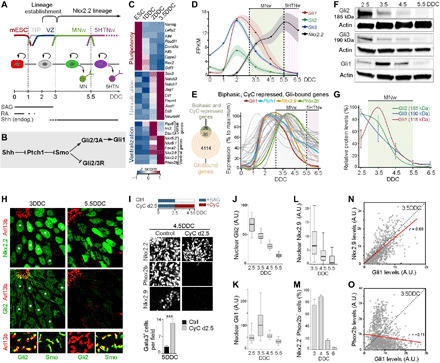
Fig. 1. Gli proteins are temporal regulators of Phox2b.

(A) Scheme of mESC differentiation. (B) Scheme of Shh signaling pathway. (C) Heatmap of expression levels of genes associated with pluripotency, neuralization, and ventralization. (D) Gene expression levels fragments per kilobase of transcript per million mapped read (FPKM) in NSCs over time. Shaded area, SEM (E) Genes with biphasic expression profile, repressed at 3.5DDC by CyC treatment (0DDC to 3.5DDC) and bound by Gli1 or Gli3, and their relative temporal expression profile. (F and G) Western blot for Gli1-3 proteins in NSCs at different DDC and corresponding quantification. (H) Immunofluorescence of Arl13b, Nkx2.2, Gli2, and Smo at 3DDC and 5.5DDC. (I) Effect of treatment of cultures with CyC from 2.5DDC on Nkx2.2, Phox2b, and Nkx2.9 expression at 4.5DDC and number of Gata3+ 5HTNs at 5DDC. (J to L) Box plot of Gli2, Gli1, and Nkx2.9 expression levels in Nkx2.2+ nuclei at different DDC. Whiskers, 5th to 95th percentile; outliers were omitted. (M) Quantification of Nkx2.2+ NSCs expressing Phox2b over time. (N and O) Scatter plot of nuclear protein levels of Gli1 with Nkx2.9 or Phox2b in Nkx2.2+ nuclei at 3.5DDC. Trend line in red; r, correlation coefficient. (F, I, and M) Error bars, means ± SEM; asterisks, Student’s t test, ***P ≤ 0.001. MNw, motor-neuron window; 5HTNw, serotonergic-neuron window; A.U., arbitrary units.
