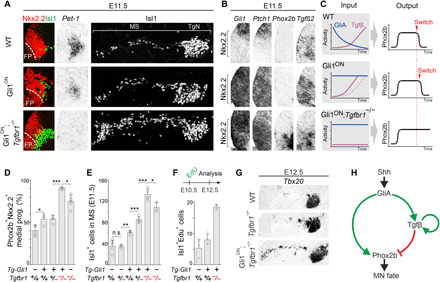
Fig. 3. A GliA-driven IFFL network controls the MN-to-5HTN switch time.

(A, B, and G) Transverse sections at r2/3 ventral hindbrain level of mouse embryos. (A and B) Expression of Nkx2.2, Isl1, Pet1, Gli1, Ptch1, Phox2b, and Tgfβ2 at E11.5 in WT and mutant embryos. (C) Summary of the effects on GliA, Tgfβ, and Phox2b expression in different mouse mutants. (D) Quantification per hemisection of Nkx2.2+Phox2b+NSCs at E10.5 in WT and mutant backgrounds. Data from WT, Tgfbr1−/−: n = 5; Tg-Gli1+::Tgfbr1+/−: n = 4; Tg-Gli1+::Tgfbr1+/+, Tg-Gli1+::Tgfbr1−/−: n = 3 animals per group. (E) Quantification per hemisection of Isl1+-MNs at E11.5 in WT and mutant backgrounds. Data from WT, Tg-Gli1+::Tgfbr1+/−, Tg-Gli1+::Tgfbr1−/−: n = 5; Tg-Gli1+::Tgfbr1+/+: n = 4; Tg-Gli1−::Tgfbr1+/−, Tg-Gli1−::Tgfbr1−/−: n = 3 animals per group. (F) Quantification of Isl1+Edu+ cells at E12.5 in WT (n = 3), Gli1ON (n = 4), and Gli1ON:Tgfbr1mut (n = 3) embryos pulsed with EdU at E10.5. (G) Expression of Tbx20+-MNs at E12.5 in WT, Tgfbr1mut, and Gli1ON:Tgfbr1mut embryos. (H) Schematic of the IFFL network. (D to F) Error bars, means ± SD. Asterisks, Student’s t test, *P ≤ 0.05, **P ≤ 0.01, and ***P ≤ 0.001. FP, floor plate; MS, migratory stream; TgN, trigeminal nuclei.
