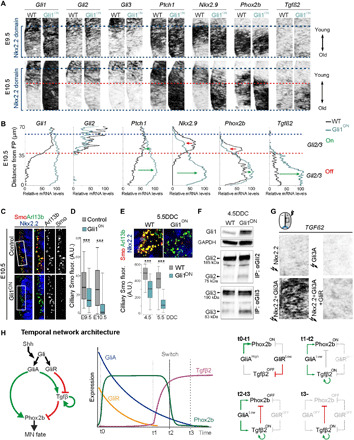
Fig. 4. Differential regulation of gene expression by GliA and GliR levels.

(A and C) Transverse sections at r2/3 ventral hindbrain level of mouse embryos. (A and B) Expression of Gli1-3, Ptch1, Nkx2.9, Phox2b, and Tgfβ2 in WT and Gli1ON embryos at E9.5 and E10.5 in Nkx2.2 progenitor domain (A) and plots of relative transcript expression levels along the ventral-dorsal extent of the Nkx2.2 progenitor domain at E10.5 (B). Blue dashed lines delimit Nkx2.2 domain; red dashed line, approximate ventral limit of Gli2/Gli3 expression. (C and D) Expression of Smo in Arl13b+ cilia within Nkx2.2 domain at E10.5 and box plots of Smo protein levels in individual Arl13+ cilia at E9.5 and E10.5 in WT and Gli1ON embryos. (E) Expression of Smo, Arl13b, and Nkx2.2 in WT and Gli1ON ESC cultures at 5.5DDC and box plots of Smo levels in Arl13+ cilia at 4.5DDC and 5.5DDC. (F) Western blot of Gli1 and of IP Gli2 or Gli3 proteins from WT and Gli1ON NSCs isolated at 4.5DDC. (G) Electroporation of CAGG constructs expressing Nkx2.2, Gli3A, Nkx2.2 + Gli3A, Nkx2.2 + Gli3A + GliR at HH12 and analysis of TGFβ2 expression in the neural tube (boxed region) after 40 hours. (H) Summary of the temporal network. (D and E) Box plots, whiskers define 5th to 95th percentile, outliers are omitted. Asterisks, pairwise Wilcoxon test, ***P ≤ 0.001.
