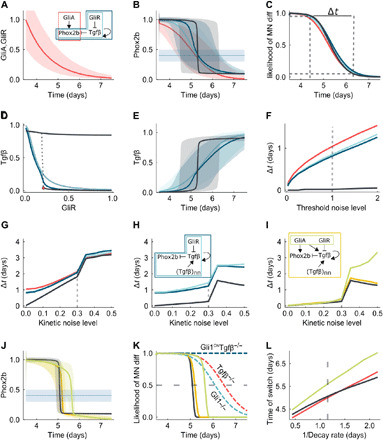
Fig. 6. Robust temporal switch by hysteresis and spatial averaging.

(A) GliA and GliR decay over time. Red line, median values; shaded area, 90% CI for 104 simulations in the presence of kinetic noise. (B) Predicted Phox2b concentration for regulatory networks shown in (A) and in case of hysteresis (black). Horizontal line and shadow, noisy threshold for motor-neuron (MN) differentiation. (C) Phox2b-dependent likelihood of MN differentiation. (D) Bifurcation diagram of Tgfβ versus GliR showing sensitivities of models without (light blue) and with (dark blue and black lines) Tgfβ self-activation. (E) Predicted Tgfβ concentration for the different networks. (F to I) Time interval to switch from MN-to-5HTN as a function of threshold noise (F) and kinetic noise (G) level for networks in (A), and considering additional Tgfβ spatial averaging (H), and a link from GliA on Phox2b and Tgfβ in the hysteretic model (black line) (I), where noise in GliA and GliR is correlated (green) or uncorrelated (yellow). (J) Predicted Phox2b concentration for models in (I). (K) Likelihood of MN differentiation for models in (I) and indicated mutant mice (dashed lines). (L) Time point of switch (differentiation likelihood, 0.5) for different GliA and GliR decay rates. Dashed gray lines in (F to I) and (L) mark the standard value used in simulations.
