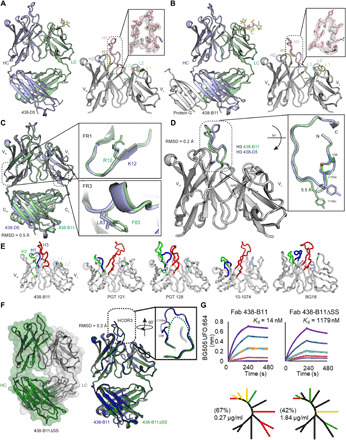
Fig. 3. Structural analysis of unbound 438-B11 and 438-D5.

(A) Crystal structure of 438-D5 Fab at 2.0 Å is shown in cartoon. The variable domain of the 438-D5 Fab is shown with HCDR loops labeled and colored for H1 (orange), H2 (blue), and H3 (pink) and LCDR loops for L1 (yellow), L2 (cyan), and L3 (green). The right inset shows the 2Fo − Fc composite omit map (contoured at 1.0σ) of HCDR3. VL, variable region of immunoglobulin light chain. (B) Crystal structure of 438-B11 Fab in complex with protein G (gray) at 2.7 Å shown in cartoon. The right inset shows the 2Fo − Fc composite omit map (contoured at 1.0 s) of HCDR3. (C) Superposition of 438-B11 (green) and 438-D5 (blue) Fab crystal structures with single-residue differences in heavy-chain FR1 and light-chain (LC) FR3 (see insets). (D) Superposition of variable domains of protein G-bound 438-B11 (green) and 438-D5 (blue) illustrates some differences at the HCDR3 apex that may be due to differences in crystal packing (see insets). (E) The variable domains from the various N332/V3-class bNAbs are shown with HCDR loops labeled and colored for H1 (blue), H2 (green), and H3 (red) and LCDR loops for L1 (light blue), L2 (light green), and L3 (light pink). (F) Crystal structure of 438-B11ΔSS Fab at 2.1 Å shown in cartoon and overlaid with transparent molecular surface representation of heavy chain (HC; green) and light chain (LC; gray). The right panel shows the superposition of unbound 438-B11 (blue) and 438-B11ΔSS (green). The inset shows the superposition of HCDR3. The disordered HCDR3 tip is shown as a dashed line. (G) (Top) Binding kinetics of 438-B11 and 438-B11ΔSS Fabs to soluble BG505 UFO.664. (Bottom) Neutralization breadth (%) and potency (μg/ml) of 438-B11 and 438-B11ΔSS on a global panel.
