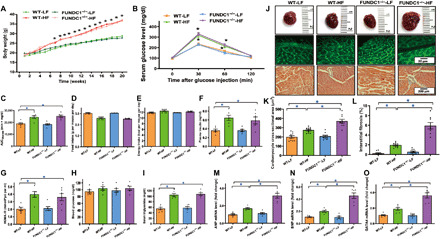
Fig. 2. HF diet intake–induced body weight gain, glucose intolerance, plasma profile, and cardiac remodeling in WT and FUNDC1−/− mice.

(A) Body weight gain over 20-week feeding period. (B) Intraperitoneal glucose tolerance test (IPGTT). (C) Area underneath IPGTT curve (AUC). (D) Food intake (by weight). (E) Food intake (by calorie). (F) Plasma insulin. (G) HOMA-IR index. (H) Fasting blood glucose. (I) Serum triglycerides. (J) Gross images, lectin, or Masson’s trichrome staining in hearts from LF or HF diet–fed mice. (K) Pool data of cardiomyocyte cross-sectional area. (L) Quantitative analysis of interstitial fibrotic area (as a percentage of entire cardiac region). (M) ANP mRNA levels. (N) BNP mRNA levels. (O) GATA4 levels. Mean ± SEM; n = 7 to 10 mice per group, *P < 0.05 between indicated groups. Photo credits: Taken by Jun Ren, Zhongshan Hospital, Fudan University.
