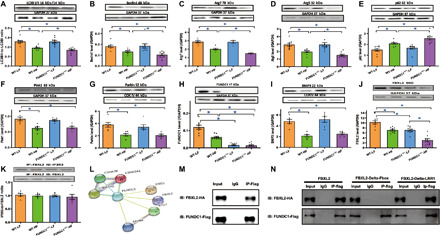
Fig. 6. Effect of HF intake on autophagy and mitophagy protein markers in WT and FUNDC1−/− mice and evidence of FUNDC1-FBXL2 interaction.

(A) LC3BI/II, (B) Beclin1, (C) Atg7, (D) Atg5, (E) p62, (F) Pink1, (G) Parkin, (H) FUNDC1, and (I) BNIP3. Insets: Representative immunoblots (IB) depicting levels of LC3BI/II, Beclin1, Atg7, Atg5, p62, Pink1, Parkin, FUNDC1, and BNIP3 using respective antibodies. GAPDH or COXIV (mitochondria) was used as the loading control. (J) Levels of FBXL2. (K) IP analysis for FBXL2-IP3R3 interaction. Bar graph depicts ratio of immunoprecipitated IP3R3 and FBXL2. (L) Co-IP mass spectrometry identified FBXL2 as an interacting protein of FUNDC1. (M) IP analysis of FBXL2 tagged with hemagglutinin (HA) (FBXL2-HA) and FUNDC1 tagged with Flag (FUNDC1-Flag) in H9c2 cells. IgG, immunoglobulin G. (N) IP analysis of FBXL2 domain mutations (Delta-F-box or Delta LRR1, HA-tagged) using FUNDC1-Flag in H9c2 cells. Mean ± SEM, n = 9 mice per group, *P < 0.05 between indicated groups.
