
Fig. 7. FBXL2 binding domain and bioinformatics prediction for FUNDC1-FBXL2 binding modality.
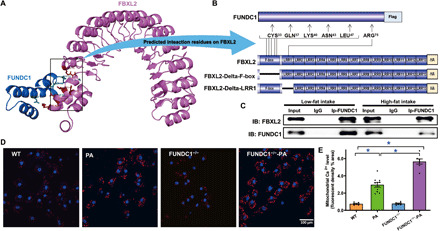
(A) Structure-based protein interaction interface analysis between FUNDC1 and FBXL2. Cartoon represents the predicted FBXL2-FUNDC1 complex structure, where the interaction hotspot residues are labeled. (B) Schematic diagram of domain deletion of FBXL2-HA for co-IP experiments, and the predicted interaction sites on FBXL2 with FUNDC1. One interaction hotspot (ARG-75) is settled on the LRR1 domain of FBXL2, while the others (CYS-33, GLN-37, LYS-40, ASN-43, and LEU-47) are all from the F-box domain. Boxes indicate exons; lines indicate deleted domains. (C) IP analysis of FBXL2 and FUNDC1 in heart tissues from LF- and HF-fed WT mouse groups. (D) Representative images displaying mitochondrial Ca2+ fluorescence in neonatal cardiomyocytes from WT and FUNDC1−/− mice challenged with palmitic acid (PA, 0.5 mM for 8 hours). (E) Pooled data of mitochondrial Ca2+ levels. Mean ± SEM, n = 7 to 10 cell batches per group, *P < 0.05 versus between indicated groups.