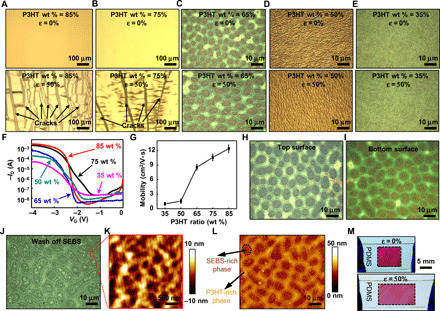
Fig. 2. The assembled freestanding composite nanofilm with different percentages of P3HT.

(A to E) Optical images of the composite nanofilm with different percentages of P3HT at 0% (top frames) and 50% strain (bottom frames). (F) Representative transfer curve of the composite nanofilm with different percentages of P3HT. (G) Mobility values of the composite nanofilm–based transistor with different percentages of P3HT. (H and I) Optical images of the top and bottom surfaces of the 65 wt % P3HT composite nanofilm located in the same position, respectively. (J) Optical image of the 65 wt % P3HT composite nanofilm after washing off the SEBS part. (K) AFM image of the P3HT-rich phase. (L) AFM image of the 65 wt % P3HT composite nanofilm marked by the composition of the two separated phases. (M) Photograph of the 65 wt % P3HT composite nanofilm deposited on a rubbery substrate, showing its high stretchability.
