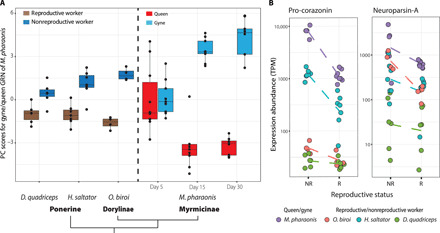
Fig. 5. Expression comparisons for genes involved in gyne-queen role differentiation for M. pharaonis and for three species from other ant subfamilies that secondarily evolved reproductive workers.

(A) Gene expression profiles (projected scores along the first PC axis) in the three ant species with reproductive role differentiation in the worker caste (left) and in the gyne caste for M. pharaonis differentiated by age (right) as illustrated in Fig. 1A. The reference PC axis for M. pharaonis was extracted from the combined data on days 15 and 30, using 170 DEGs with consistent differential expression on these 2 days and with one-to-one orthologs in all four ant species. The plotted values were the PC scores calculated from the expression profiles of these 170 genes, weighted by the gene-specific relative contributions to the overall gyne-queen DEG segregation in M. pharaonis. (B) Expression levels for two genes that were significantly differentially expressed between gynes and queens of M. pharaonis and exhibited the same direction of expression bias in nonreproductive (NR) versus reproductive (R) workers in the three other ant species. Dots represent the gene expression levels in each brain sample and solid lines connect the averages. Even shallow negative slopes represent considerable differences because expression abundances are plotted on a logarithmic scale. TPM, Transcripts Per Million.
