
Fig. 3. Endothelial response to flow in straight and spiral vessels.
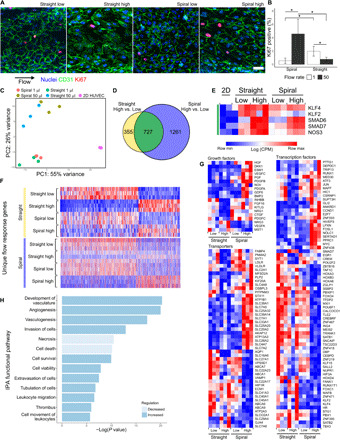
(A) MIP of EC cultured under flow (Q = 50 μl/min) for 24 hours. Blue, nuclei; green, CD31; red, Ki67. Scale bar, 50 μm. (B) Quantification of the percentage of Ki67-positive nuclei by counting 100+ cells per vessel in N = 3 vessels at two flow conditions (Q = 1 and 50 μl/min). Error bars represent 95% confidence interval of the mean. *P < 0.05 using a one-way analysis of variance (ANOVA) with Tukey’s pairwise comparisons. (C) PCA of RNA-seq data from cells cultured at static and at two flow conditions in two vessel geometries (N = 3). (D) Venn diagram showing the overlap of genes significantly changed by increasing flow in straight and spiral geometries. (E) Heatmap of log counts per million (CPM) values of known flow-responsive genes. All genes are present in the overlapping region of (D) (green). (F) Heatmaps of the CPM values of significantly regulated transcripts belonging to the nonoverlapping regions of (D). Three hundred fifty-five genes uniquely regulated in straight high versus low (top, yellow) and 1261 genes uniquely regulated in spiral high versus low (bottom, blue). (G) Heatmaps of the CPM values of selected growth factors, transporters, and transcription factors. (H) IPA functional pathways identified by comparing spiral to straight vessels under high flow.