
Fig. 1. Behavioral and neuroanatomical evolution in larval A. mexicanus.
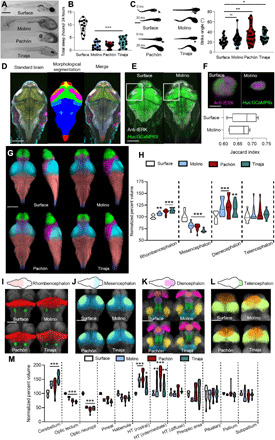
(A) Image of 6–dpf (days postfertilization) fish. Scale bar, 500 μm. (B) Total sleep over 24 hours in 6-dpf A. mexicanus [one-way analysis of variance (ANOVA), F = 51.53, P < 0.0001; Dunnett’s to surface: Molino, P < 0.001; Pachòn, P < 0.001; and Tinaja, P < 0.001). (C) Feeding angle orienting to prey (0 ms) and then immediately after strike (20 ms) (Kruskal-Wallis test = 13.39, P = 0.003; Dunnett’s to surface: Molino, P > 0.56; Pachón, P < 0.01; and Tinaja, P < 0.03). ns, not significant. (D) Standard brain with labels registered to the template brain (left). Segmentations applied to the template brain (middle). Merge of standard brain with anatomical segmentations (right). (E) Registrations of Huc:GCaMP6s reveals overlap of tERK with transgenic label. (F) Projection of anatomical overlap between Huc:GCaMP (green) and tERK (magenta) of optic neuropil. (G) Segmentation of developmental regions of brains using tERK staining: telencephalon (green), diencephalon (magenta), mesencephalon (cyan), rhombencephalon (red), and spine (blue). Scale bar, 300 μm. (H) Developmental regions relative to whole-brain size. Two-way ANOVA: genotype, F = 13.91, P < 0.001; brain region, F = 3134, P < 0.001; interaction, F = 0.65, P = 0.58. Dunnett’s: rhombencephalon, Molino, P < 0.01; Pachòn, P < 0.001; and Tinaja, P < 0.001. Mesencephalon, Molino, P < 0.001; Pachòn, P < 0.001; and Tinaja, P < 0.001. Diencephalon, Molino, P < 0.001; Pachòn, P < 0.001; and Tinaja, P < 0.01. Telencephalon, Molino, P = 0.74; Pachòn, P = 0.68; Tinaja, P > 0.89. (I) Volumetric projections of nuclei within the rhombencephalon: cerebellum (red) and locus coeruleus (green). Scale bar, 200 μm. (J) Nuclei within the mesencephalon. Optic tectum (blue) and optic neuropil (light green). Scale bar, 200 μm. (K) Nuclei in the diencephalon: pineal gland (light red), habenula (pink), preoptic hypothalamus (purple), rostral zone of the hypothalamus (green), intermediate zone of the hypothalamus (blue), diffuse nucleus of the hypothalamus (yellow), and pituitary complex (dark blue). Scale bar, 100 μm. (L) Nuclei within telencephalon: subpallium (orange) and pallium (light green). Scale bar, 100 μm. (M) Quantifications of (F) to (I) normalized to surface fish. *P ≤ 0.05, **P < 0.01, and ***P < 0.005 for indicated comparisons in all statistical tests.