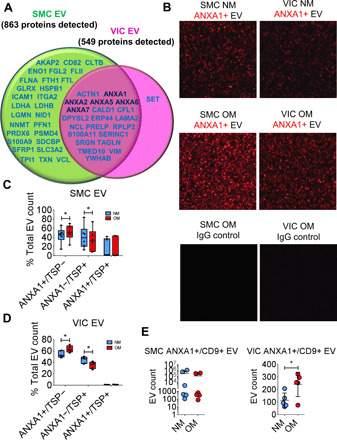
Fig. 3. Human SMC EV and VIC EV contained tethering proteins.

(A) Venn diagram of detected EV proteins increased in OM, with the green circle including proteins detected in SMC EV (n = 9 donors) and pink circle including proteins detected in VIC EV (n = 7 donors). Annexin proteins (ANXA1, ANXA2, ANXA5, ANXA6, and ANXA7) detected in both SMC EV and VIC EV and increased in OM in either or both are indicated in dark blue. Additional proteins detected and increased in OM in SMC EV (green circle), VIC EV (pink circle), or both SMC EV and VIC EV (overlapping region) are indicated in light blue. Full comparative EV proteomics dataset and statistical analysis included in data file S1. (B) Representative single-EV microarray images obtained using the ExoView R100 platform with SMC EV (n = 6 donors) and VIC EV (n = 5 donors). Top and middle panels show ANXA1+ EV in NM and OM with ANXA1+ capture, and bottom panels show lack of ANXA1+ EV with IgG negative control capture. (C) Box and whisker plots for single-EV microarray assessment of ANXA1+ EV, tetraspanin+ EV (TSP+; CD9/CD63/CD81), and ANXA1+/TSP+ EV from SMCs (n = 6 donors, *P < 0.05, analyzed by Wilcoxon matched pairs test) and (D) VICs (n = 5 donors, *P < 0.05 analyzed by Welch’s t test) cultured in NM or OM. Data presented as a percentage of the total EV count (ANXA1+, TSP+, and ANXA1+/TSP+ EV combined) for each donor. (E) Single-EV microarray EV count for ANXA1+/CD9+ EV in SMCs (n = 6 donors, error bars are means ± SD) and VICs (n = 5 donors, error bars are means ± SD, *P < 0.05 analyzed by Welch’s t test) cultured in NM and OM.
