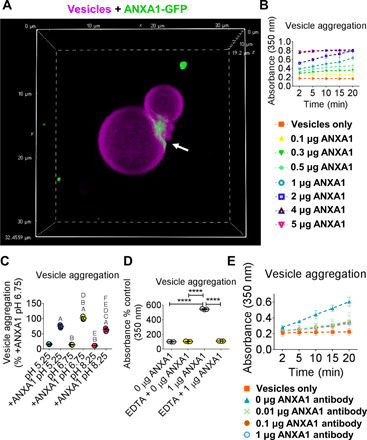
Fig. 5. ANXA1 tethered vesicles and its inhibition suppressed vesicle aggregation.

(A) Confocal Z stack image of DiR′ [DiIC18(7) 1,1′-dioctadecyl-3,3,3′,3′-tetramethylindotricarbocyanine iodide]–labeled (purple color) swelling produced vesicles with ANXA1-GFP (green color) binding at vesicle tethered sites (white arrow) (x and y planes, 32.4559 μm, and z, 19.2 μm); n = 3 experiments, with representative image shown. Movie of ANXA1-GFP vesicle binding included as movie S1. (B) ANXA1 time- and concentration-dependent vesicle aggregation with extrusion produced vesicles; error bars are means ± SD from three experiments. (C) pH-dependent vesicle aggregation with extrusion produced vesicles with 1 μg of ANXA1 (+ANXA1) or without ANXA1; data are means ± SD from three experiments. (D) EDTA and (E) N-terminal ANXA1 neutralizing antibody aggregation inhibition of extrusion produced vesicles. Error bars are means ± SD from three experiments. ****P < 0.0001, A < 0.0001 versus pH 5.25, B < 0.0001 versus +ANXA1 pH 5.25, C < 0.05 versus +ANXA1 pH 5.25, D < 0.0001 versus pH 6.75, E < 0.0001 versus +ANXA1 pH 6.75, F < 0.0001 versus pH 8.25, analyzed by ANOVA.
