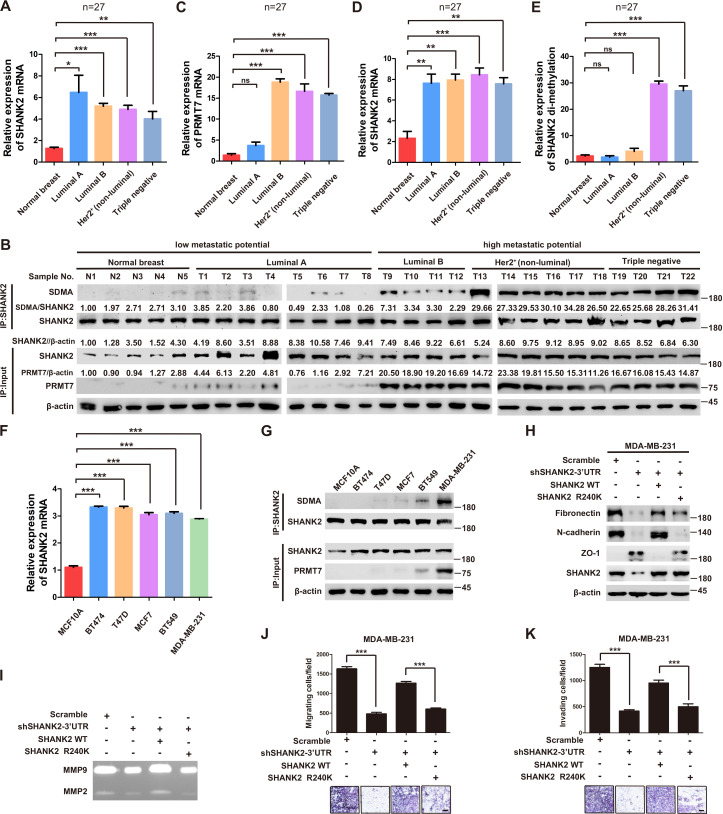
Figure 3. SHANK2 R240 methylation promoted migration and invasion of breast cancer cells.
(A) Comparison of SHANK2 expression level in breast cancer tissues of different breast cancer subtypes with that in normal tissues by RT-PCR. The logarithmic scale of 2-ΔΔCt was used to measure the fold-change. β-actin was used as an internal reference. n = 27, *p<0.05, **p<0.01, ***p<0.001, one-way ANOVA test. (B–E) Comparison of PRMT7, SHANK2 and di-methylated SHANK2 levels in breast cancer tissues using western blot analysis. Data are based on the analysis of independent samples (n = 27). Immunoprecipitation of SHANK2 with anti-SHANK2 antibody was performed. *p<0.05, **p<0.01, ***p<0.001, ns = not significant, one-way ANOVA test. (F) SHANK2 mRNA expression in indicated breast cancer cell lines by RT-PCR. The logarithmic scale of 2-ΔΔCt was used to measure the fold-change. β-actin was used as an internal reference. ***p<0.001, Student’s t test. (G) SHANK2 was IP from indicated breast cancer cell lines lysate, and input lysates and IP samples were analyzed using anti-methylation, anti-SHANK2 or anti-PRMT7 antibodies, as indicated. (H) MDA-MB-231 cells expressing SHANK2 shRNA and reconstituted expression of SHANK2 WT or SHANK2 R240K mutant. Western blot was performed with the indicated EMT marker antibodies. (I) MDA-MB-231 cells with or without stable expression of the indicated SHANK2 shRNA were transfected with SHANK2 WT or SHANK2 R240K mutant. Assessment of MMP2 and MMP9 enzymatic activities by gelatin zymography. (J and K) MDA-MB-231 cells expressing SHANK2 shRNA and reconstituted expression of SHANK2 WT or SHANK2 R240K mutant. Cell migration (J) and Invasion (K) were determined by transwell assays. (n = 3, independent experiments). Scale bars: 100 µm. Data represent the mean ± SD of three independent experiments. ***p<0.001, Student’s t test.
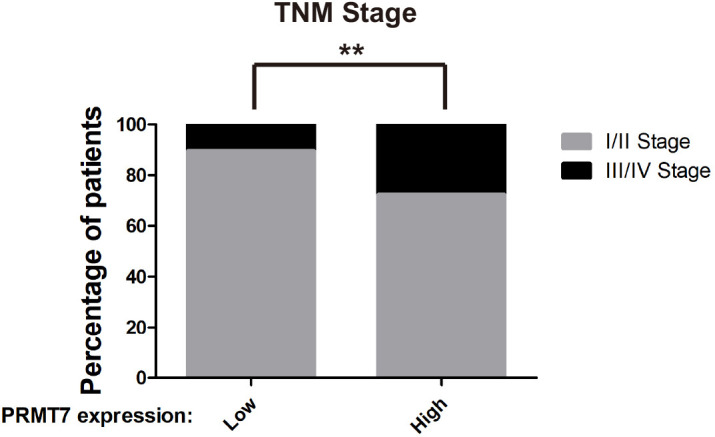
Figure 3—figure supplement 1. PRMT7 was associated with clinical outcomes.


