. 2020 Aug 3;9:e53392. doi: 10.7554/eLife.53392

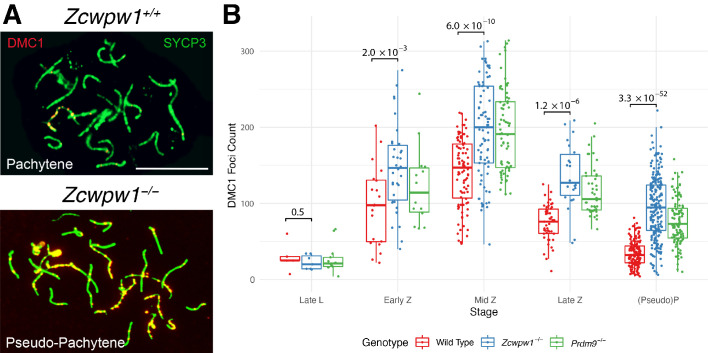
Figure 4. Similar DMC1 count elevation in Zcwpw1−/− and Prdm9−/− mice, compared to wild-type.

(A) Testis chromosome spreads from 9- to 10-week-old Zcwpw1+/+ and Zcwpw1−/− mice were immunostained for DMC1 and SYCP3. Late (pseudo)-Pachytene cells are shown. These images are representative of the data obtained for three mice per genotype. Scale bar: 10 μm. (B) The number of DMC1 foci in cells from the indicated stages of prophase I were counted; see Figure 4—source data 1 for number of cells per stage per mouse. p-values are from Welch’s two sided, two sample t-test. L: Leptotene, Z: Zygotene, P: Pachytene. n = 3 mice for Zcwpw1−/− and wild-type, n = 2 for Prdm9−/−. Raw data in Figure 4—source data 1.

Figure 4—source data 1. Raw data for DMC1, RAD51 and RPA2 foci counts.
Stages: L, Leptotene; Z, Zygotene; P, Pachytene. WT: wild-type. Mouse ID is consistent across Figure 3—source data 1 and 2 and Figure 4—source data 1.

Figure 4.

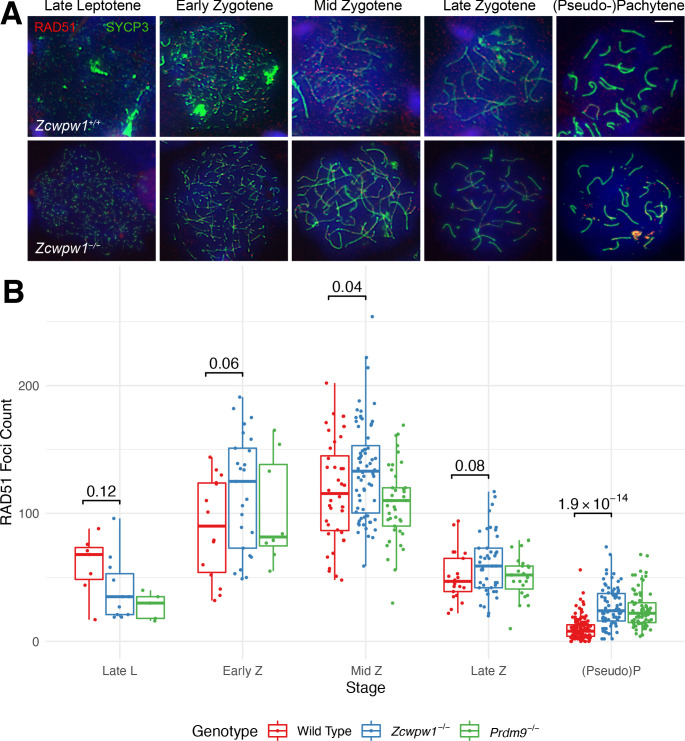
Figure 4—figure supplement 1. Similar RAD51 count elevation in Zcwpw1−/− and Prdm9−/− mice, compared to wild-type.

Figure 4—figure supplement 1.

(A) Testis chromosome spreads from 9- to 10-week-old Zcwpw1+/+ and Zcwpw1−/− mice were immunostained with antibodies against the synaptonemal complex protein SYCP3 and the recombinase RAD51, and counterstained with DAPI to visualise nuclei. Developmental stages are indicated at the top. These images are representative of the results obtained for three mice per genotype. Scale bar: 10 μm. (B) The number of RAD51 foci in cells from the indicated stages of prophase I were counted; see Figure 4—source data 1 for the number of cells per stage per mouse. p-values are from Welch’s two sided, two sample t-test. L: Leptotene, Z: Zygotene, P: Pachytene. n = 2 mice per genotype (Zcwpw1−/− and WT), n = 1 for Prdm9−/− (Raw data in Figure 4—source data 1).
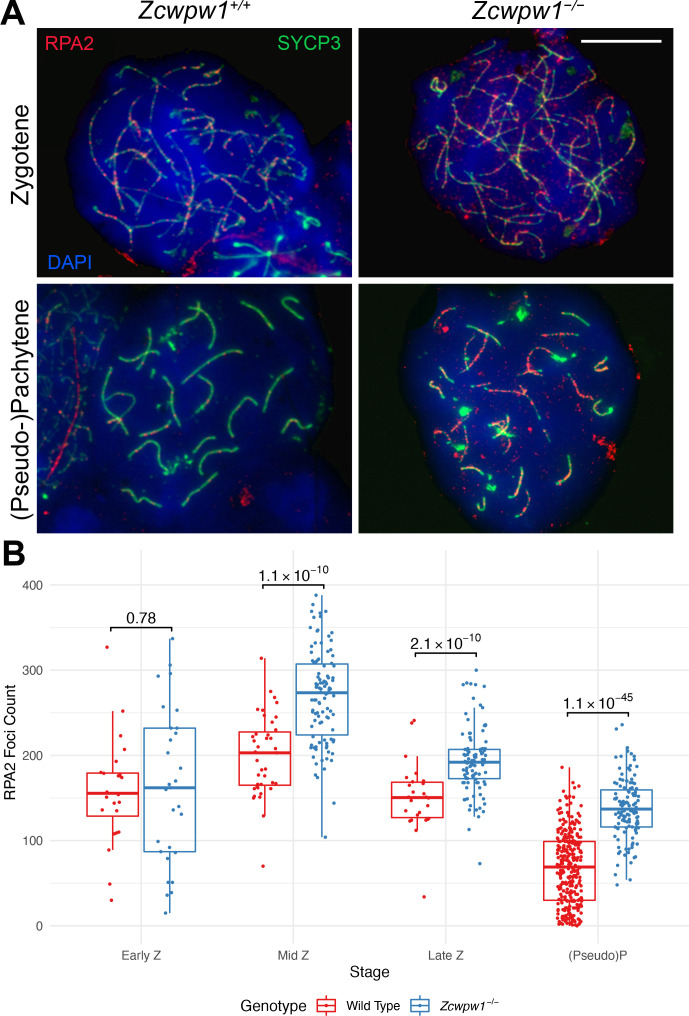
Figure 4—figure supplement 2. RPA2 count elevation in the Zcwpw1−/− mouse.

Figure 4—figure supplement 2.

(A) Testis chromosome spreads from 9- to 10-week-old Zcwpw1+/+ and Zcwpw1−/− mice were immunostained with antibodies against SYCP3 and RPA2, and counterstained with DAPI to visualise nuclei. Developmental stages are indicated on the side. These images are representative of the results obtained for three mice per genotype. Scale bar: 10 μm. (B) The number of RPA2 foci in cells from the indicated stages of prophase I were counted; see Figure 4—source data 1 for the number of cells per stage per mouse. p-values are from Welch’s two sided, two sample t-test. Z: Zygotene, P: Pachytene. n = 3 mice per genotype (Raw data in Figure 4—source data 1).
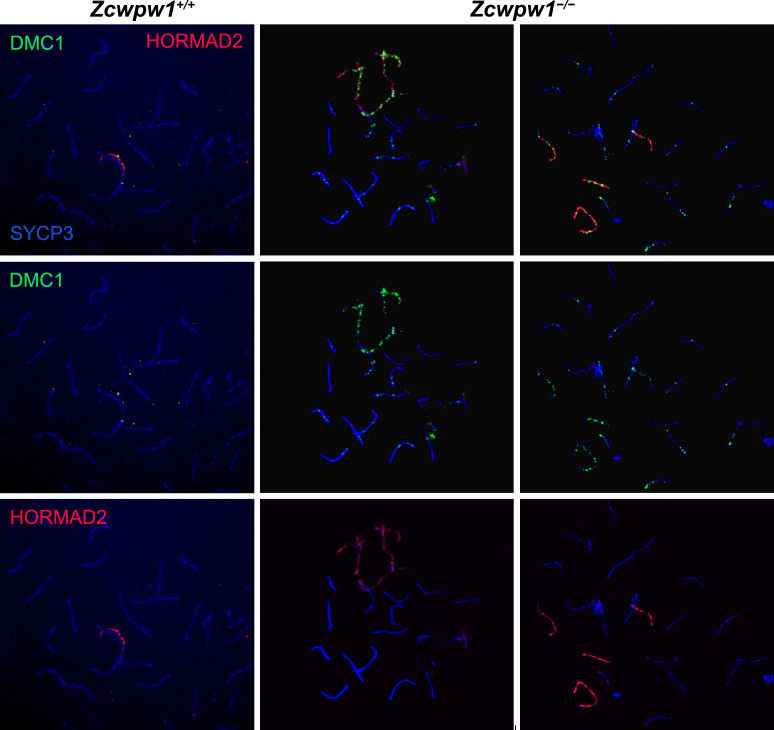
Figure 4—figure supplement 3. DSB repair is delayed with accumulation of DMC1 on asynapsed chromosomes in the Zcwpw1−/− mouse.

Figure 4—figure supplement 3.

Testis chromosome spreads from 9- to 10-week-old Zcwpw1+/+ and Zcwpw1−/− mice were immunostained for DMC1, HORMAD2, and SYCP3. Representative images of two mutant pseudo-pachytene cells show accumulation of DMC1 foci on HORMAD2-positive asynapsed chromosomes. In contrast wild-type pachytene cells only show residual DMC1 foci on partially synapsed XY sex chromosomes. Note that in mutant cells, even synapsed chromosomes abnormally retain some level of DMC1. These images are representative of the results obtained for three mice per genotype. Scale bar: 10 μm.