. 2020 Aug 3;9:e53392. doi: 10.7554/eLife.53392

Figure 5. Enrichment and binding profiles of ZCWPW1 and other factors.

(A) Enrichment of ZCWPW1 (with vs without PRDM9) at PRDM9-binding sites when co-transfected with PRDM9 with either Human or Chimp Zinc Finger (Materials and methods section ‘Enrichment Profiles’). Q = quartile. Human PRDM9 sites are centered and stranded by the motif. Y-axis is log10 scale (y-axis labels remaining in linear space). (B) Profiles and heatmaps of reads from cells co-transfected with human (h) or chimp (c) PRDM9 around the top 25% of individual human PRDM9-binding sites (rows). Heatmaps: log-fold change of target (indicated in column titles, Materials and methods) vs input, for various labelled target proteins, ordered by human PRDM9. ZCWPW1, H3K4me3 and H3K36me3 each become enriched at human PRDM9 sites, following (co-)transfection with human PRDM9. Profiles: Sum of all target coverage divided by sum of all input coverage for all regions shown in the heatmap, shown on a linear scale. w\o, without. (C) ChIP-seq data and annotation in a genome plot illustrate the behaviour of ZCWPW1 and other factors. ChIP-seq tracks show fragment coverage. Tracks where PRDM9 is present are labeled ‘w/PRDM9’, and below, corresponding tracks without PRDM9. ZCWPW1 binds to Alus, CpG islands and other CpG-rich sequences even in the absence of PRDM9. On addition of PRDM9, ZCWPW1 becomes strongly enriched at PRDM9 binding locations (center left peak within DIO1). mCpG, methylated CpG.

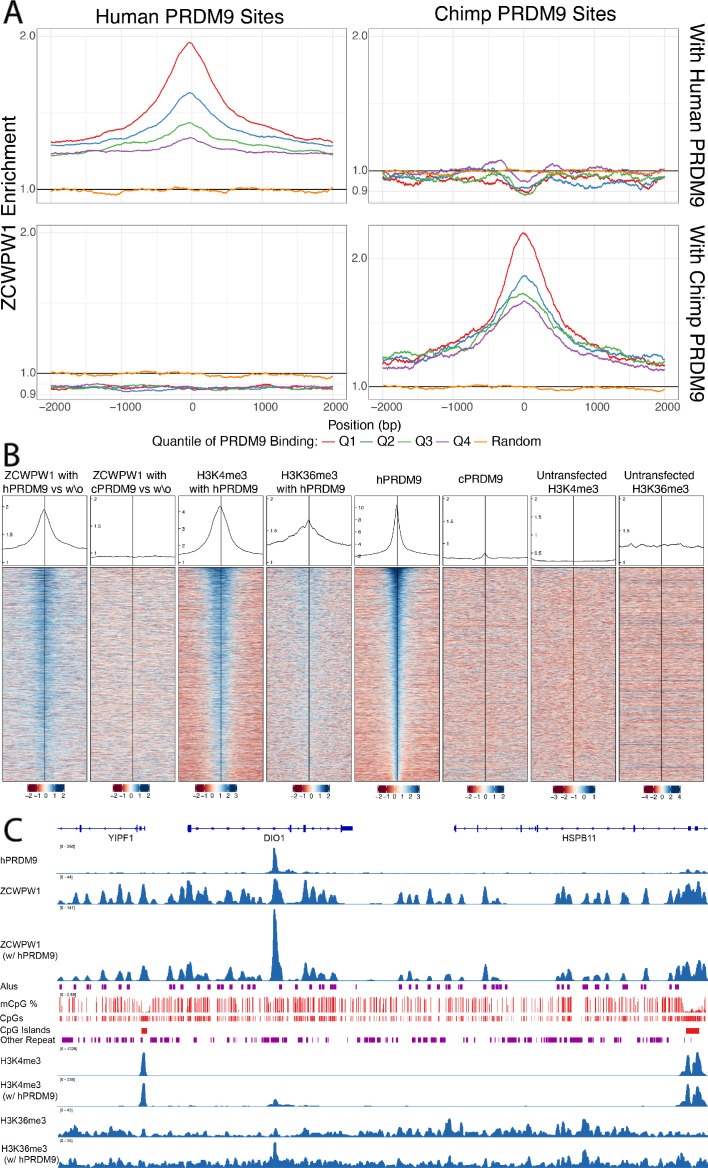
Figure 5—source data 1. RT-PCR analysis of PRDM9, ZCWPW1 and ZCWPW2 transcript expression in HEK293T cells.
Cells were transfected with the indicated constructs (one biological replicate per sample). Each PCR reaction was carried out in triplicate (three technical replicates per sample), and the mean Ct value was used to calculate the relative expression of each gene relative to the basal expression in untransfected cells, normalised to endogenous GAPDH levels (ΔΔCt method). Formula: 2^(Ct gene in untransfected cells - Ct gene in transfected cells)/2^(Ct GAPDH in untransfected cells - Ct GAPDH in transfected cells). Expression of ZCWPW2 was only detected in cells transfected with a construct encoding hZCWPW2-HA. Stdev, standard deviation. *For calculation purposes, Cts were assigned the maximum value of 40 cycles of amplification in all samples not transfected with hZCWPW2-HA (no detectable amplification). **Gene expression was normalised to GAPDH and expressed relative to the expression in untransfected cells.

Figure 5.

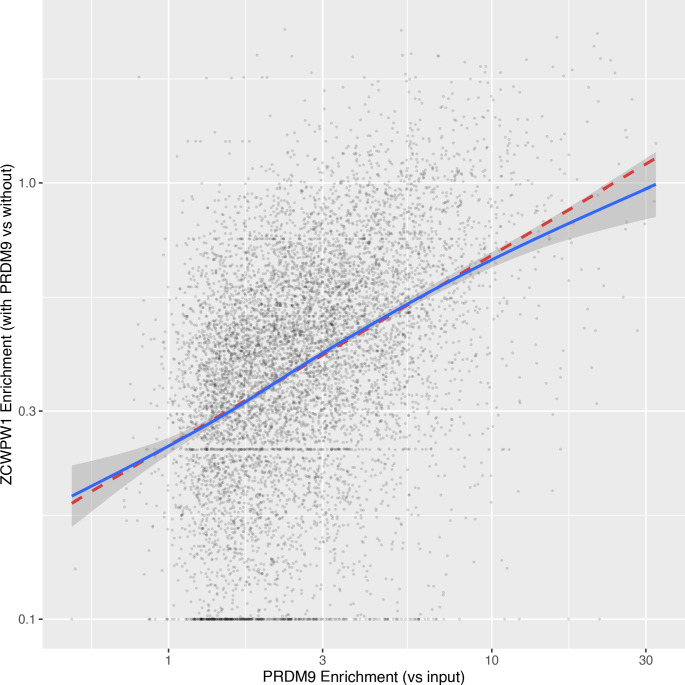
Figure 5—figure supplement 1. Correlation between PRDM9 enrichment and ZCWPW1 enrichment at sites of PRDM9 binding.

Figure 5—figure supplement 1.

ZCWPW1 binding with vs without PRDM9 was force called at sites with PRDM9 peaks (Materials and methods). Peaks were excluded if PRDM9 input coverage was ≤10 or ZCWPW1 input coverage was ≤3. Additionally, the top 10 peaks (out of 8,373) by enrichment for each of PRDM9 and ZCWPW1 were excluded to remove outliers. The red dashed line shows the fit of a linear model (log(ZCWPW1+0.1)~a + b*log(PRDM9+0.1)) and the blue line and grey error shows a Generalised Additive Model smooth. For plotting, each axis is displayed with a log10 scale (with break values shown in linear space) and 0.1 was added to all values (x and y) to avoid infinite values.
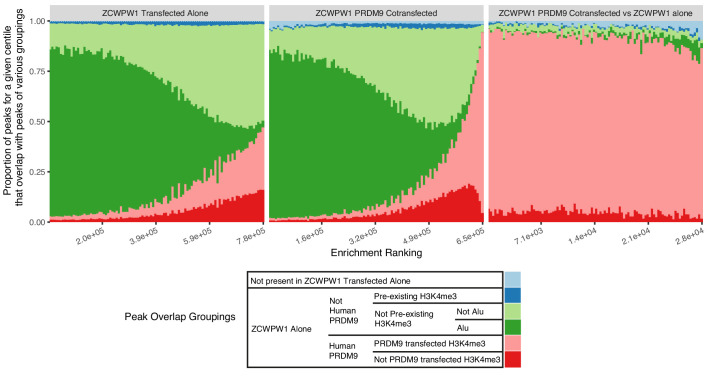
Figure 5—figure supplement 2. Proportion of ZCWPW1 peaks, ordered by enrichment of ZCWPW1 binding over input, overlapping various other marks.

Figure 5—figure supplement 2.

For example dark green peaks are those which overlap with ZCWPW1 peaks when transfected alone, but not overlapping Human PRDM9 peaks, and not overlapping pre-existing H3K4me3 peaks but do overlap with Alu repeats. Pre-existing H3K4me3 refers to H3K4me3 peaks found without PRDM9 or ZCWPW1 transfection. The three plots show results for peaks in HEK293T cells with ZCWPW1 transfected alone (Left), PRDM9+ZCWPW1 co-transfection (Middle), and peaks whose ZCWPW1 occupancy increases in PRDM9+ZCWPW1 vs ZCWPW1 transfected alone (Right, Materials and methods). In cells expressing ZCWPW1 in the presence (middle plot) but not in the absence (left plot) of PRDM9, the strongest peaks are dominated by PRDM9-bound sites marked by H3K4me3 (pink), while ZCWPW1 occupancy increases occur nearly exclusively at these sites, following co-transfection with PRDM9 (right plot).
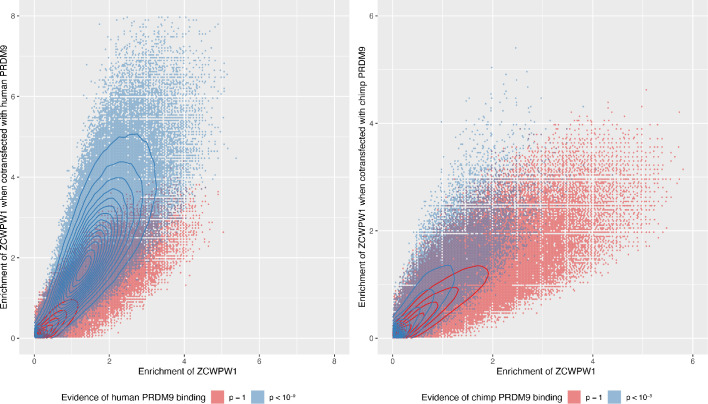
Figure 5—figure supplement 3. Enrichment of ZCWPW1 when co-transfected with human or chimp PRDM9 is dependent on the ability of ZCWPW1 to bind, more weakly, in the absence of PRDM9 (there are no peaks with high co-transfected enrichment [y-axis] when the untransfected enrichment [x-axis] is close to 0) and co-transfecting with PRDM9 increases the enrichment.

Figure 5—figure supplement 3.

Enrichment was force called in 100bp windows across all autosomes. Data is conditioned on having input coverage of >5 and enrichment >0.01 for both axes. Hexagons are coloured if at least three data points are present. Solid lines show density contours estimated by MASS::kde2d() in R.
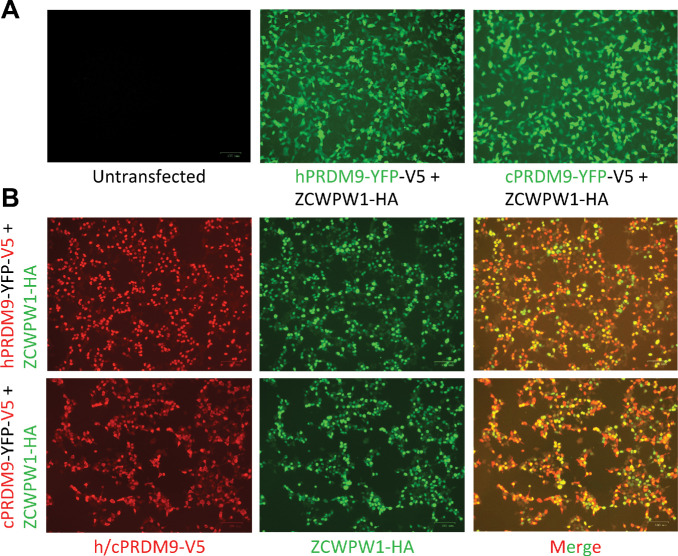
Figure 5—figure supplement 4. Co-expression of ZCWPW1 and PRDM9 in HEK293T cells.

Figure 5—figure supplement 4.

Cells were co-transfected with human (h) or chimp (c) PRDM9-YFP-V5 (hPRDM9-YFP-V5 or cPRDM9-YFP-V5, respectively) and ZCWPW1-HA, or mock transfected (untransfected). (A) Direct microscopic observation of transfected cells shows high and comparable levels of YFP fluorescence emitted from hPRDM9-YFP-V5 and cPRDM9-YFP-V5. (B) Immunofluorescence staining against the protein tags (HA and V5) shows high and comparable expression levels of each protein across transfected samples, and a reasonable proportion of co-expressing cells with merged overlapping signals (ranging from light green to yellow and light red depending on the expression ratio of the two proteins).
Figure 5—figure supplement 5. Profiles and heatmaps of reads at locations of either chimp PRDM9 binding or ZCWPW1 binding when co-transfected with human PRDM9.

Figure 5—figure supplement 5.

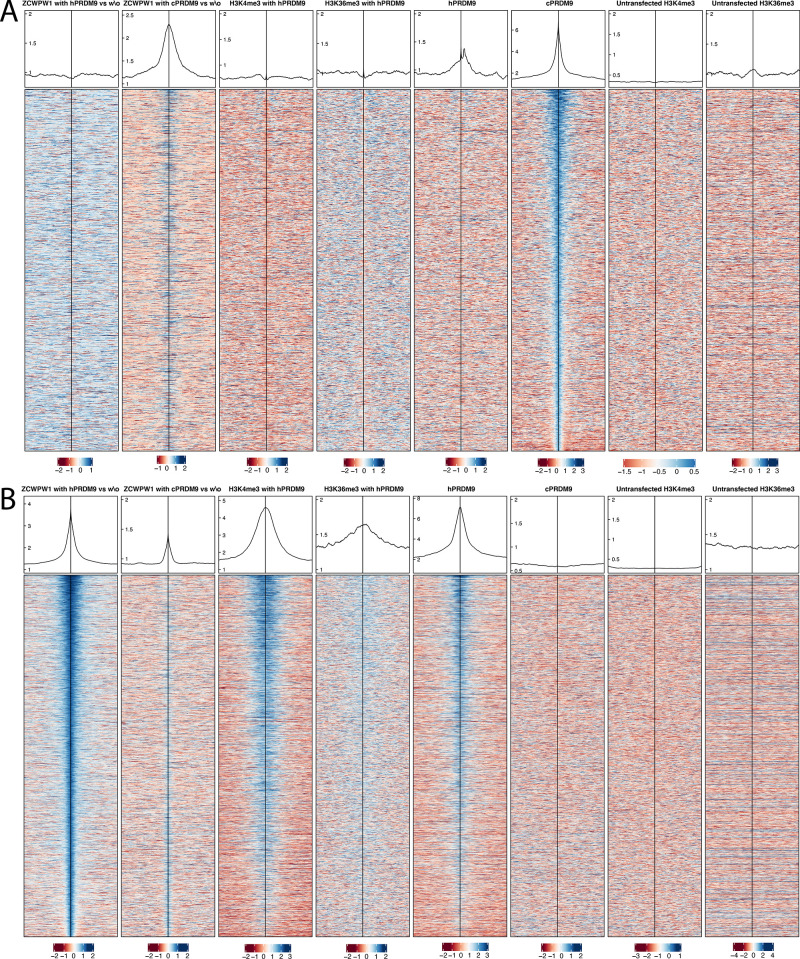
(A) Profiles and heatmaps of reads at locations of chimp PRDM9 (cPRDM9) binding. Heatmaps show log fold change of sample (as indicated in the title of each column, Materials and methods) vs input, for the top ¼ of cPRDM9 peaks, for various samples, ordered by cPRDM9. ZCWPW1 is found at sites of cPRDM9 peaks, when co-transfected with cPRDM9, but not at human PRDM9 (hPRDM9) peaks. w\o, without. (B) Profiles and heatmaps of reads at locations of ZCWPW1 binding co-transfected with human PRDM9 (hPRDM9). Heatmaps show log fold change of sample (as indicated in the title of each column, Materials and methods) vs input, for the top ¼ of ZCWPW1 peaks when co-transfected with PRDM9, for various samples, ordered by first column. Note that H3K4me3, H3K36me3 and hPRDM9 are found at ZCWPW1 peaks when co-transfected with hPRDM9.
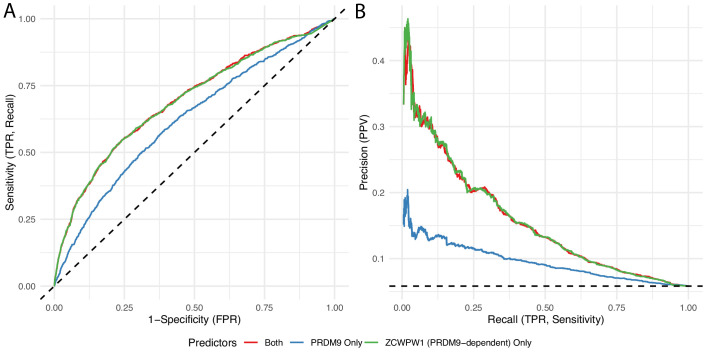
Figure 5—figure supplement 6. Among human PRDM9 binding sites, we identified those at which male recombination hotspots occur, defined by the presence/absence of an overlapping human DMC1 peak, and fitted a linear model to predict this hotspot status based on PRDM9 binding strength (PRDM9 Only), ZCWPW1 enrichment (with human PRDM9 vs without, referring to enrichment of ZCWPW1 co-transfected with PRDM9 relative to ZCWPW1 transfected alone), or both (see Materials and methods ‘DMC1 prediction’). We fitted a logistic regression model, and present the results in the form of standard Receiver Operating Characteristic curves (A) and Precision Recall Curves (B).

Figure 5—figure supplement 6.

Lines with greater area under the curve (those higher up) represent greater predictive ability (models better able to classify/separate PRDM9 sites into those with DMC1 binding and those without). Black dotted lines show a baseline of random prediction. TPR: True positive rate, FPR: False positive rate. PPV: positive predictive value (proportion of predicted positives that are true positives). Estimated PRDM9-dependent ZCWPW1 enrichment (green) provides a better predictor than does PRDM9 binding strength (blue).