. 2020 Aug 3;9:e53392. doi: 10.7554/eLife.53392

Figure 7. DMC1 levels in the Zcwpw1−/− mouse compared to DMC1 and SPO11 levels in WT.

(A) DSBs occur at normal hotspot locations in the Zcwpw1−/− male mouse. Average coverage of reads from DMC1 SSDS ChIP-seq in a 10-week-old mouse at previously mapped regions (Materials and methods) in B6 WT (left) and Prdm9−/− (right) mice is shown, centered at the PRDM9 motif (left). DMC1 profiles from a WT mouse are shown in red, data from Brick et al., 2012. (B) Normalised DMC1 profile (both strands combined) is plotted for WT and Zcwpw1−/−, stratified by H3K4me3 (a proxy for PRDM9 binding). Low: <50th percentile cumulative enrichment, High: >75th percentile cumulative enrichment, with Medium being the remaining data. Greyed out lines show the alternative genotype for comparison. (C) Relationship between WT SPO11-oligos (measuring the number of DSBs) vs DMC1 (a measure of the number and persistence of DSBs) at each B6 hotspot for WT and Zcwpw1−/−. Unlike WT mice, DMC1 signals in Zcwpw1−/− mice are approximately linearly associated with WT SPO11. The DMC1 enrichment was force called at the positions of B6 WT hotspots. Black dashed line is y = x for reference. SPO11 and DMC1 enrichment have been scaled by dividing by the mean autosomal enrichment. Large dark blue and dark red points show mean DMC1 signal, binned into groups containing equal numbers of hotspots by WT SPO11 signal (vertical lines: corresponding 95% CIs), for X (10 bins) and autosomal data (100 bins) respectively (smaller lighter dots represent individual hotspots).

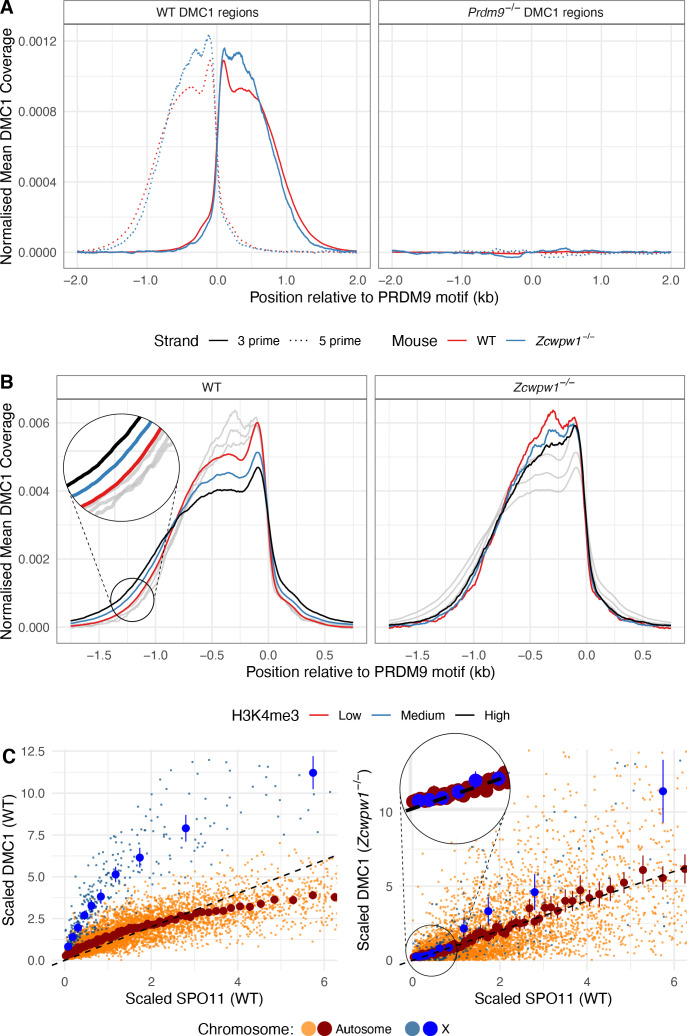
Figure 7.

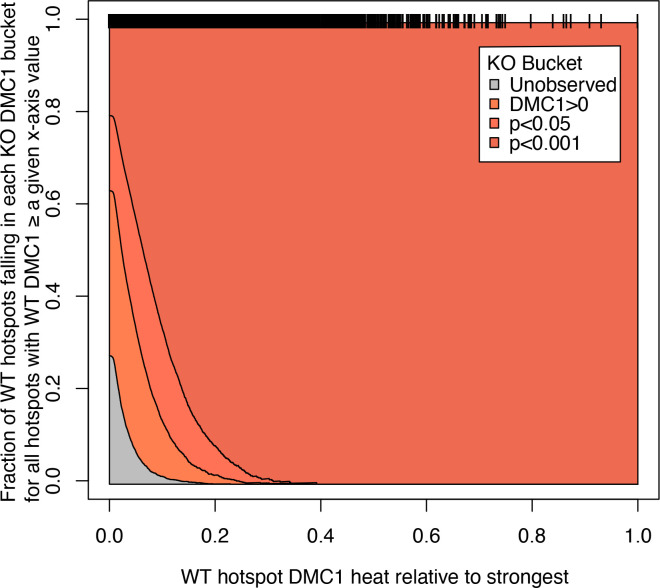
Figure 7—figure supplement 1. Fraction of wild-type (WT) hotspot locations seen in Zcwpw1−/− DMC1 ChIP-seq at different p-values.

Figure 7—figure supplement 1.

Black bars along the top of the plot show the heat of individual hotspots relative to the hottest, according to the DMC1 data, in the WT male mouse. Y-axis values at x = 0 show the fraction of all hotspots falling into the buckets shown in the inset colour legend. As the x-axis increases the y-axis values show the same thing, but only for those hotspots with a heat greater than or equal to the x-axis value, that is those black bars further to the right. Therefore, almost all WT hotspots with activity >20% of the hottest hotspot are observed, and non-observed hotspots show only weak activity in WT, and so our power to detect them is expected to be reduced. ‘DMC1>0’ refers to the hotspot locations at which DMC1 signal is observed in Zcwpw1−/− DMC1 ChIP-seq, but with significance level (p-value) greater than or equal to 0.05, ‘p<0.05’ refers to the locations at which this significance level is less than 0.05 but greater or equal to 0.001, and ‘p<0.001’ refers to locations at which the p-value is less than 0.001.
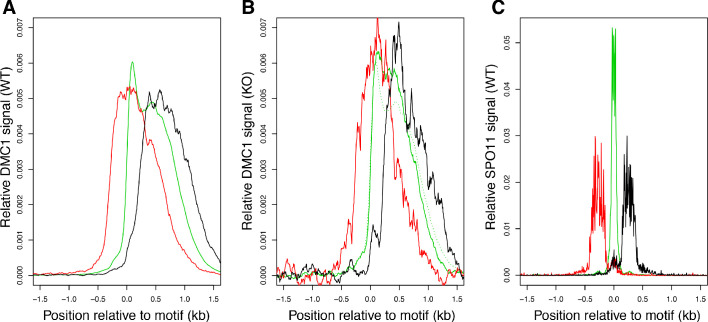
Figure 7—figure supplement 2. DSBs in Zcwpw1−/− are positioned at WT locations within hotspots.

Figure 7—figure supplement 2.

Hotspots relative to PRDM9 binding motif: upstream (red), downstream (black), central (green). For DMC1 hotspots with an identified PRDM9-binding motif (Materials and methods), we measured positions relative to this motif and identified hotspots in three groups according to SPO11 signal: Green: active hotspots (top 30%) with >90% of the SPO11 signal in the central 300bp region. Red: >90% upstream of the PRDM9 binding motif (position <0) and <50% central. Black: >90% downstream of the PRDM9 binding motif and <50% central. We then plotted the average profiles of DMC1 in wild-type (WT) (left), DMC1 in Zcwpw1−/− (KO) mice (middle) and SPO11 (right), normalised to have unit area. Hotspots with more upstream/downstream DSB sites (SPO11) also show more upstream/downstream DMC1 signals, in both WT and KO mice.
Figure 7—figure supplement 3. Relationship between WT SPO11-oligos (measuring the number of DSBs) vs DMC1 (a measure of the number and persistence of DSBs) at each B6 hotspot for Hop2−/− male mice (A) Zcwpw1−/− (B) and WT (C) as in Figure 7C are replotted, for comparison.

Figure 7—figure supplement 3.

Similarly to Figure 7C, the DMC1 enrichment was force called at the positions of B6 WT hotspots, in the Hop2−/− data from GSM851661 (Khil et al., 2012). SPO11 and DMC1 enrichment have been scaled by dividing by the mean autosomal enrichment. Blue points are X chromosome data, orange points are autosomal. Large blue and black points show mean DMC1 signal binned into groups containing equal numbers of hotspots by WT SPO11 signal (vertical lines: corresponding 95% CIs), for X and autosomal data, respectively. Other details as for Figure 7C. Hop2−/− (A) and Zcwpw1−/− (B) mouse KO mutants show a similar linear relationship of DMC1 ChIP-seq vs SPO11.
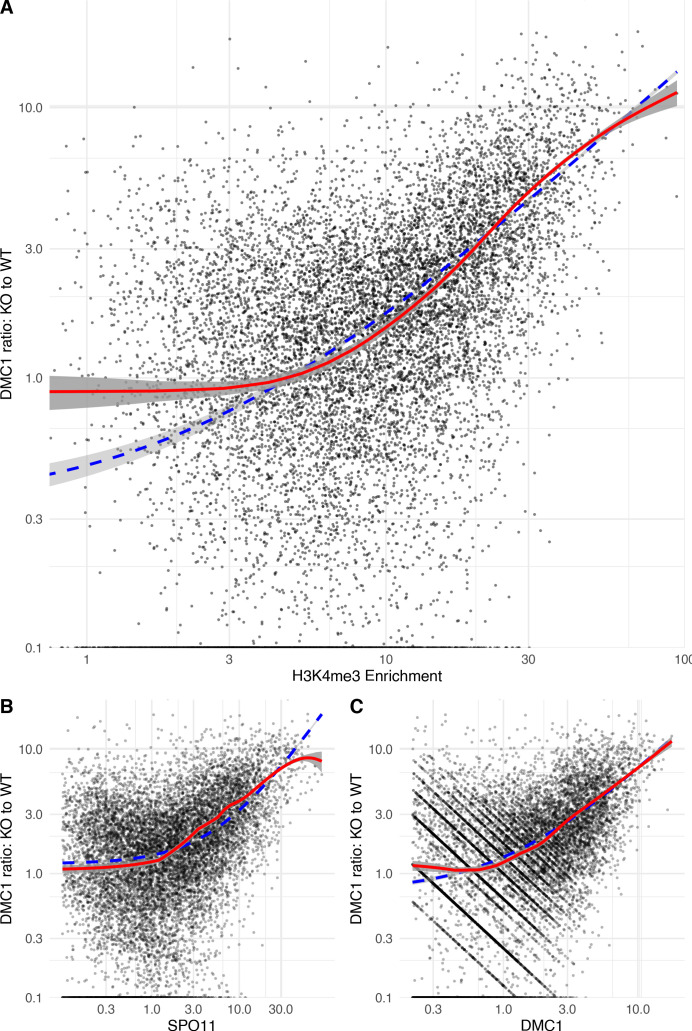
Figure 7—figure supplement 4. Regression of the ratio of DMC1 signal in the Zcwpw1−/− (KO) vs wild-type (WT) male mice against H3K4me3 [a proxy of PRDM9 binding] (A), SPO11 (B), and DMC1 (C) in WT.

Figure 7—figure supplement 4.

The DMC1 signal in the KO relative to the WT increases as H3K4me3 (~PRDM9) increases. We calculated the ratio of KO to WT DMC1 force-called enrichment at each autosomal B6 mouse hotspot not overlapping pre-existing H3K4me3. We excluded weak hotspots whose estimated SPO11 or DMC1 WT heats were in the bottom 10% (because accurate ratio estimation is not possible for these hotspots). Dots: the force-called signal strength (of either H3K4me3, SPO11 or WT DCM1), vs the ratio, for each of the resulting hotspots. Blue dashed line, linear regression line of best fit (fit in linear space, displayed in log space). Red line: Generalised Additive model (able to fit non-linear effects if present, again fit in linear space).