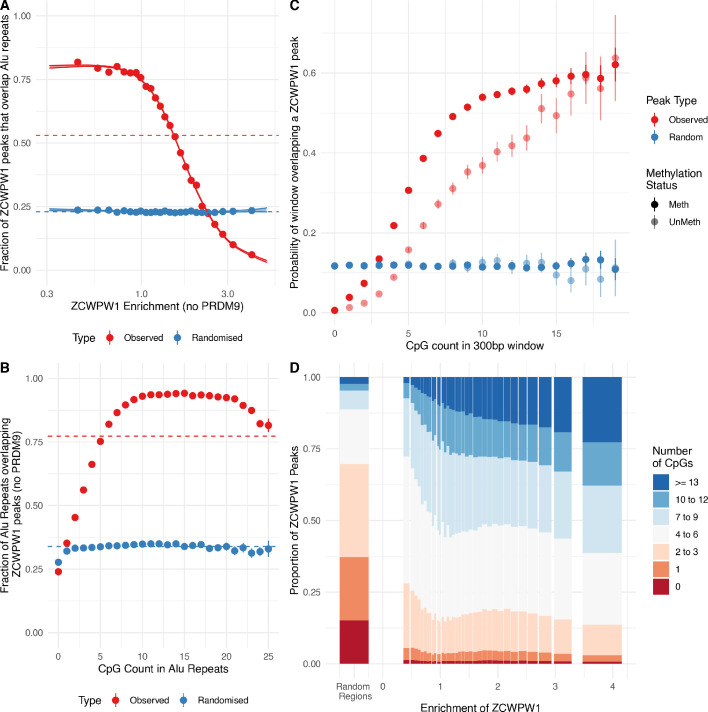
Figure 8. ZCWPW1 binds CpG-rich sequences such as Alu repeats.
(A) Fraction of overlap of ZCWPW1 binding peaks, , with Alusin HEK293T cells transfected with ZCWPW1 alone, ordered by enrichment in ZCWPW1 binding. ZCWPW1 peaks are binned into 25 bins with equal number of data points, and means of both enrichment and overlap are plotted. Solid ribbons: prediction from GAM logistic regression. Dotted lines: overall means. Red points show actual observed peaks, blue points the same number of peaks placed at random genomic positions. (B) Rate of overlap of Alu repeats with ZCWPW1 peaks, for Alus with different numbers of CpG dinucleotides. Other details as A. (C) The probability of a 300bp window on an autosome overlapping a ZCWPW1 peak increases with increasing CpG count in that window. Windows overlapping (by 10bp or more) Alus, other repeats, or CpG islands have been excluded. Methylated CpG regions (full colour) are those with a methylated to unmethylated reads ratio of >0.75, and unmethylated <0.25 (semi-transparent, Materials and methods). (D) Relative proportion of peaks with given numbers of CpGs (stacked bars) +/− 150bp from peak center, within peaks binned by ZCWPW1 enrichment (x-axis). ZCWPW1 peaks are enriched in CpGs compared to random peak locations (leftmost bar). ‘Meth’, methylated; ‘UnMeth’, unmethylated.


