
Author response image 2. Black: Profile of peaks.
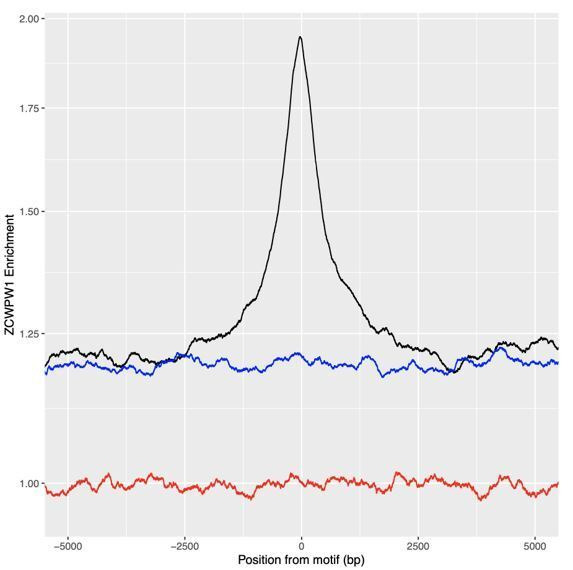
Blue: profile of locations 15 to 10kb downstream. Red: profile of globally (whole genome) random locations.
Official websites use .gov
A
.gov website belongs to an official
government organization in the United States.
Secure .gov websites use HTTPS
A lock (
) or https:// means you've safely
connected to the .gov website. Share sensitive
information only on official, secure websites.
Blue: profile of locations 15 to 10kb downstream. Red: profile of globally (whole genome) random locations.