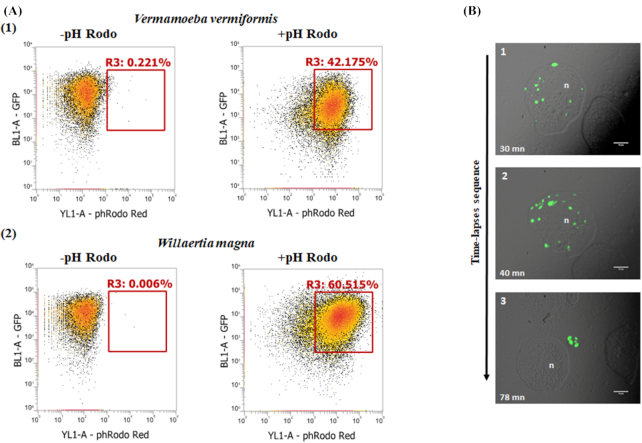
Figure 6.
Amoebal intracellular pH analysis. (A) Amoebae infected with GFP-H. pylori for 2 h at 37⁰C, analysis of intracellular pH dynamics evaluated by flow cytometry. The fluorescence percentage represents the occurrence of acidic phagosomes with or without treatment with red fluorescent intracellular pH indicator (pHrodo Red); (1) V. vermiformis (2) W. magna. (B) Green fluorescent intracellular pH indicator in W. magna infected with non GFP-H. pylori and treated with pHrodo Green. Time-lapse fluorescent micrographs representing: Panel (1) and (2) acidic phagosomes formation; and (3) release of phagosome containing H. pylori from trophozoite after 78 min; n, nucleus; (100x objective).

