Figure 4.
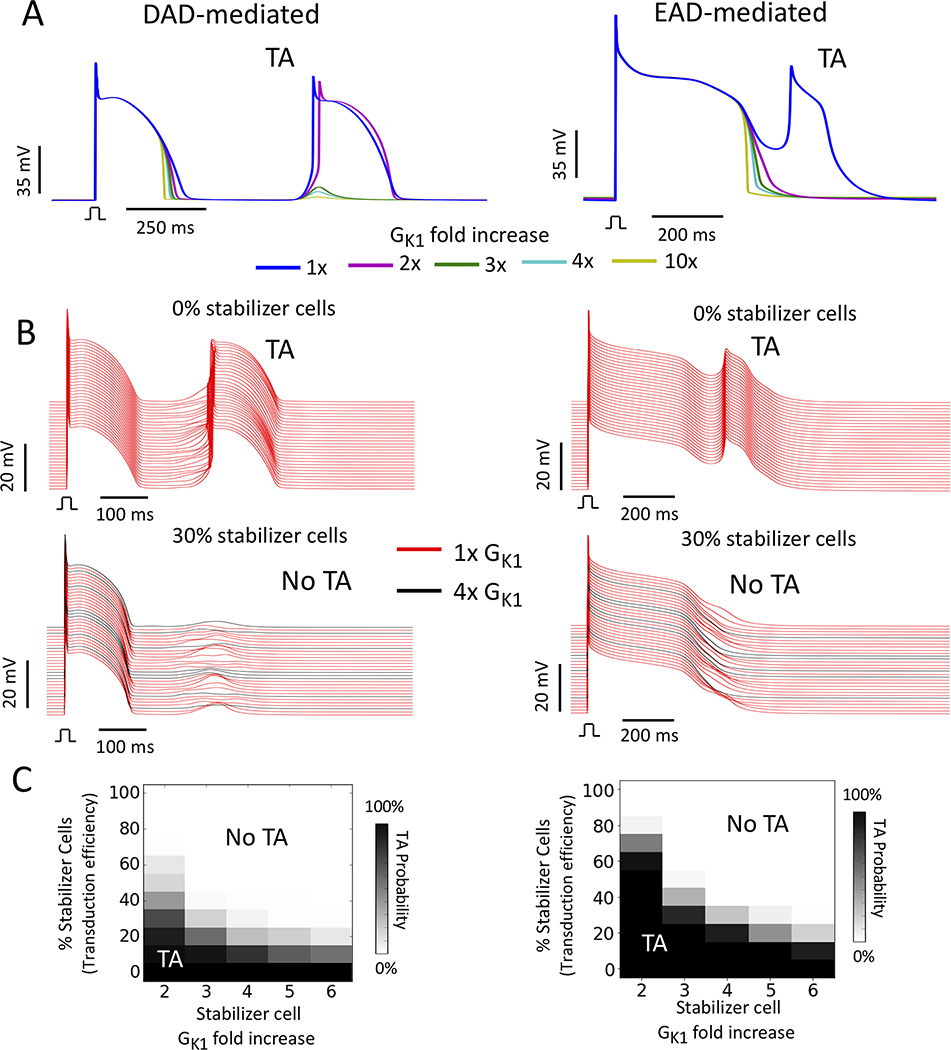
Suppression of DAD- and EAD-mediated TA by stabilizer cells with enhanced GK1. (A) Simulations of single uncoupled myocytes exhibiting a suprathreshold DAD (left, Gspon=0.2 ms−1) or EAD (right) as the control value of GK1 was increased from 2- to 10-fold. DAD- and EAD-mediated TA was suppressed by 3-fold and 2-fold increases in GK1, respectively. (B) Upper: Corresponding 1D cables of 100 coupled cells exhibiting DAD- (left) and EAD-mediated (right) TA (red traces). Lower: Suppression of DAD- (left) and EAD-mediated (right) TA by 30% stabilizer cells with GK1 enhanced 4-fold (black traces) randomly distributed among the arrhythmogenic cells (red traces). (Note: not all stabilizer cell traces are shown since only every 10th cell is plotted). (C) Percent of randomly-distributed stabilizer cells required to suppress DAD- (left) or EAD-mediated (right) TA (TA) in 1D cables versus the fold-increase in GK1 in stabilizer cells.

