
Figure 4. Phenotypic similarity between Taok3−/− mice and Jnk1−/− mice.
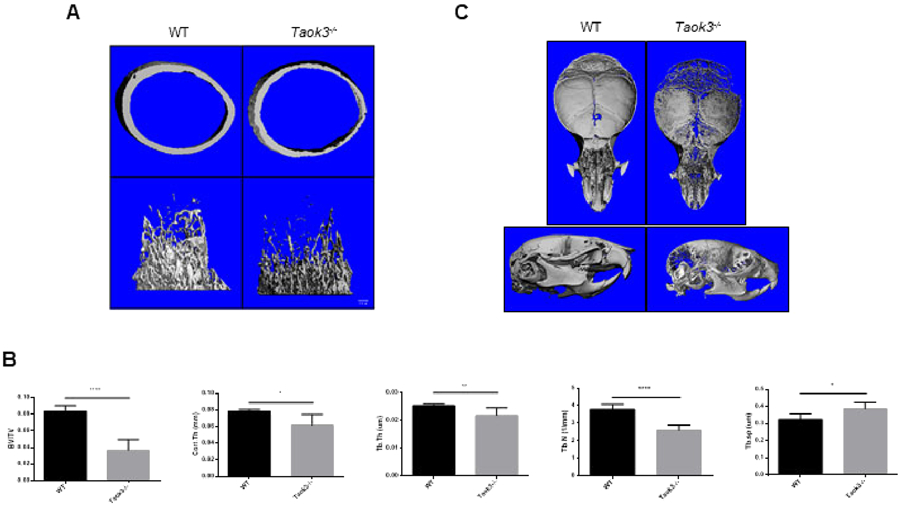
(A) 3-dimensional reconstructions of μCT analysis showing the femurs of 4-week-old male mice (n=6 per group). Displayed are cortical bone (top) and trabecular bone (bottom).
(B) Quantification of femoral bone mass of 4-week-old male mice using μCT analysis (n=6 per group). Bone volume/total volume (BV/TV), cortical thickness (Cort. Th), and trabecular thickness (Tb. Th.) were all significantly reduced. *p<0.05, ** p<0.01, ***p<0.001.
(C) 3-dimensional reconstructions of μCT analysis showing the skulls of 4-week-old male mice (n=6 per group). Displayed are vi(top) and lateral view (bottom).