
Figure 2: EGCG induces cell death by apoptosis in pancreatic, colon, and lung cancer cells.
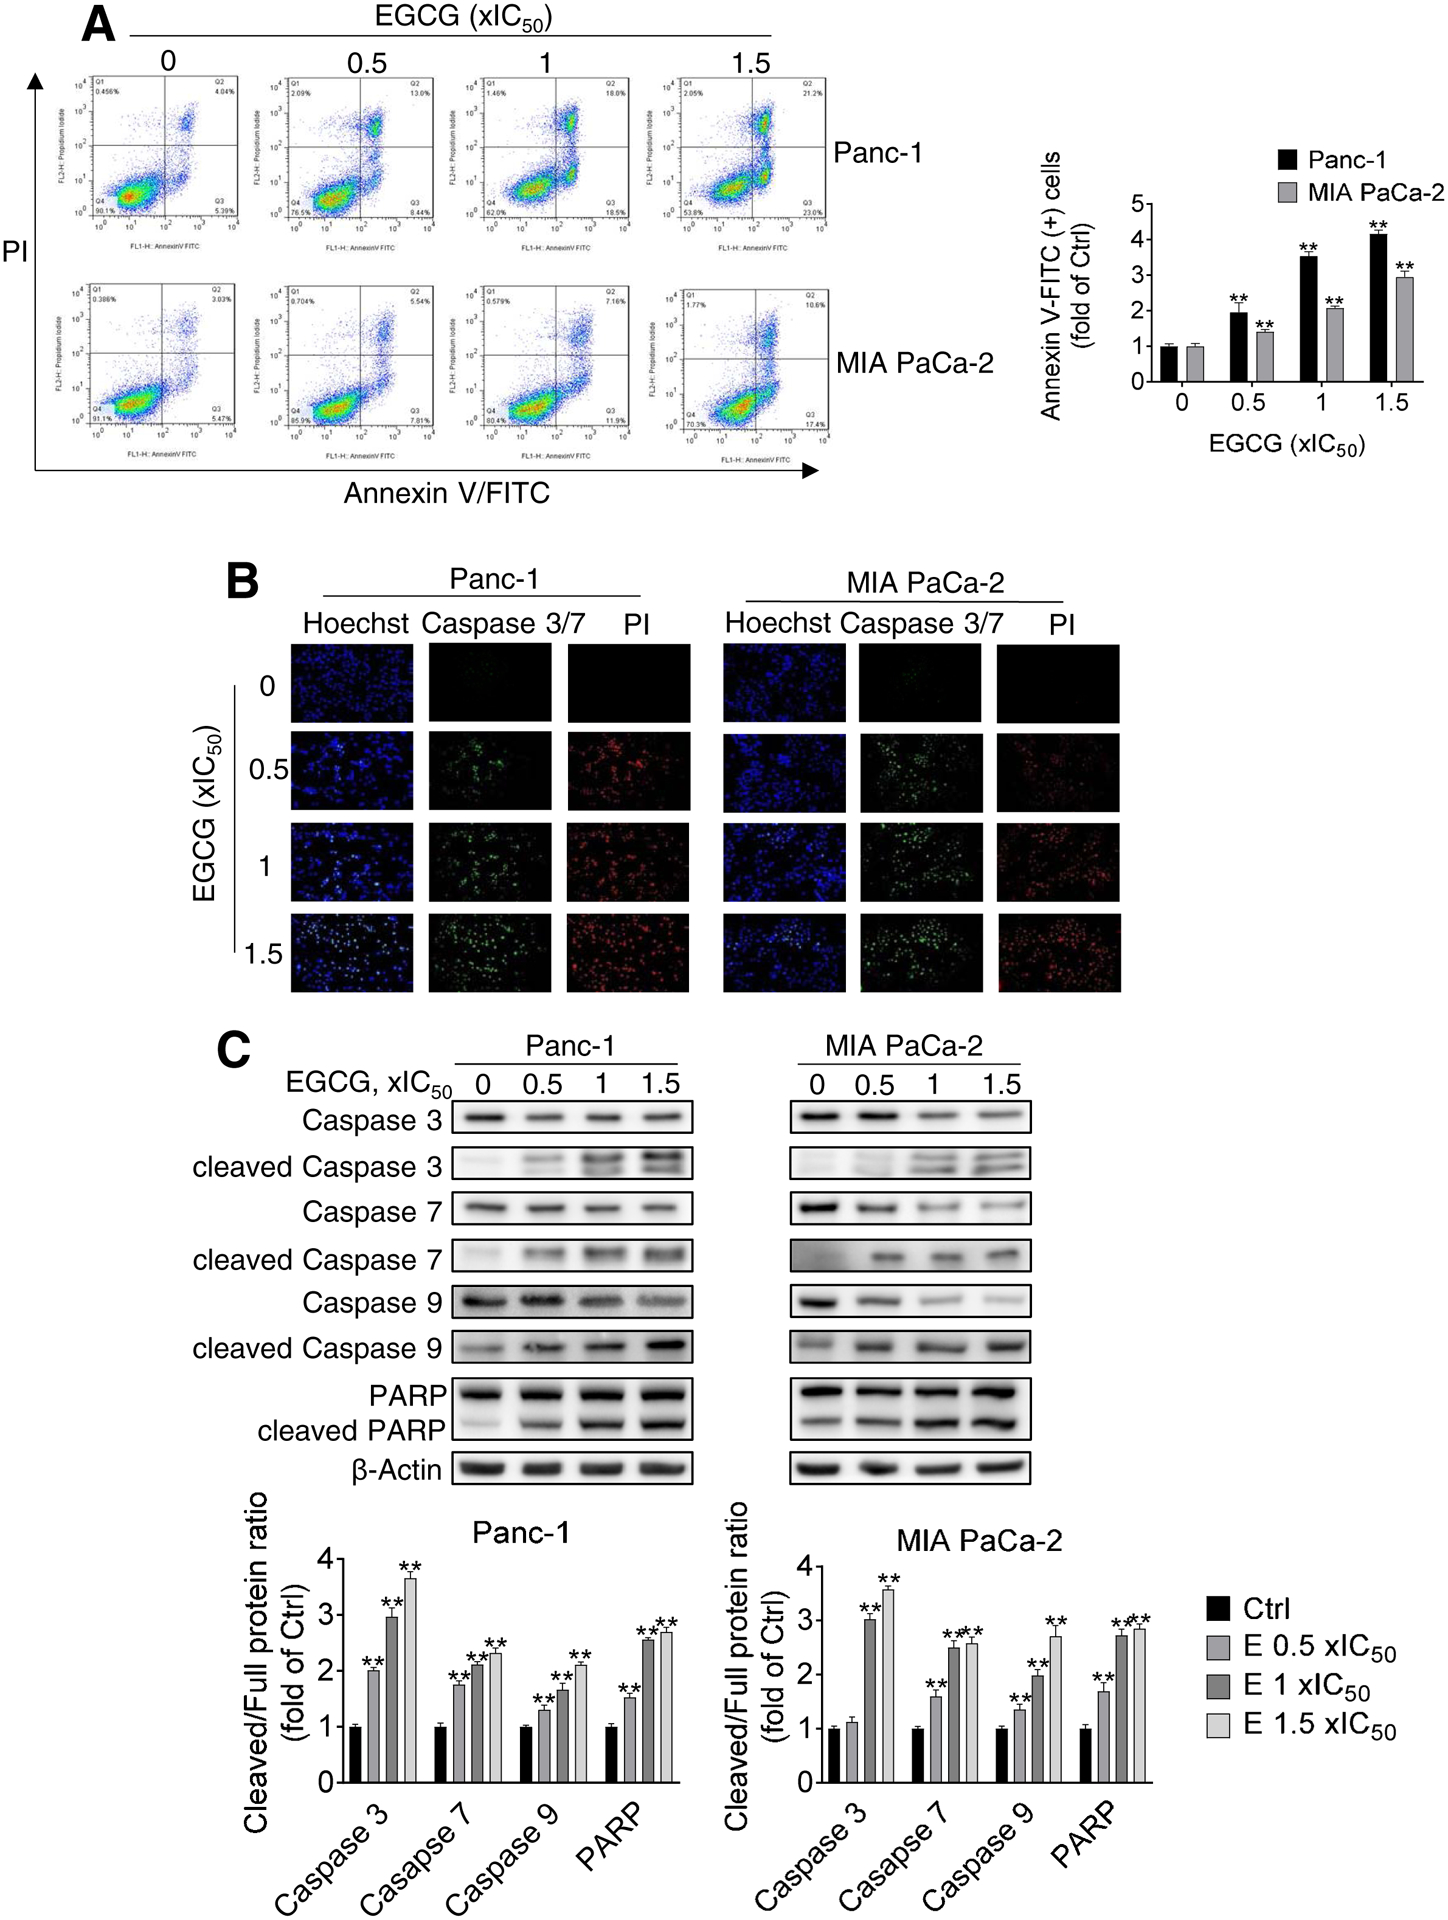
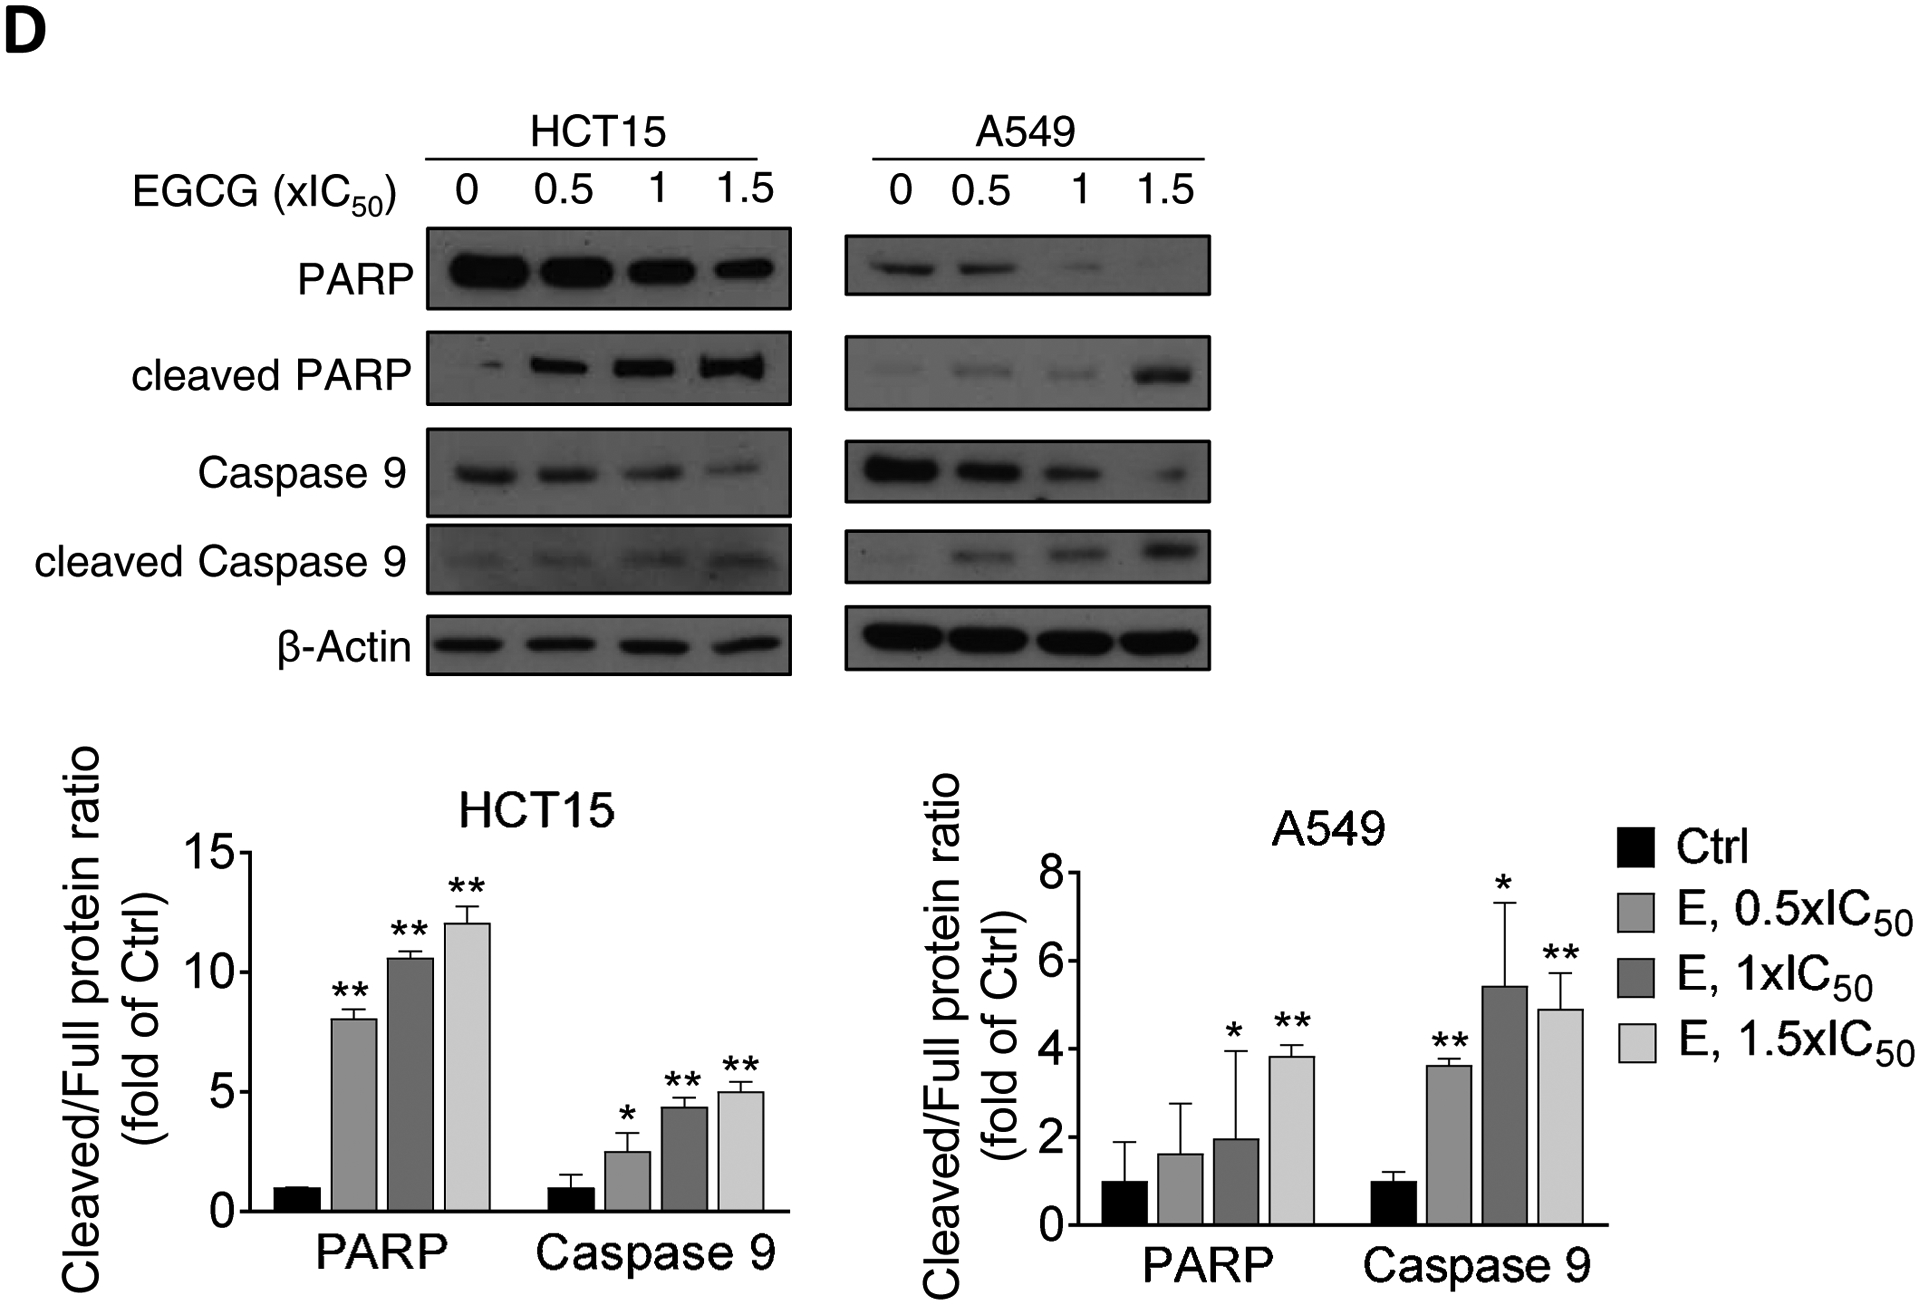
A: Panc-1 and MIA PaCa-2 cells, treated with EGCG for 48 h, were stained with Annexin V/propidium iodide (PI), and the percentage of apoptotic cells was determined by flow cytometry. Results are expressed as fold change of control. *p<0.05, **p<0.01 vs. control. B: Caspase 3/7 activation was examined by immunofluorescence, by triple-staining control and EGCG-treated cells with Hoechst, PI and Caspase 3/7 green detection reagents. Representative images are shown (200x). C: Immunoblots for full length and cleaved caspases 3,7, and 9 as well as full length and cleaved PARP in total cell protein extracts from Panc-1 and MIA PaCa-2 cells treated with escalating concentrations of EGCG (0.5x, 1x and 1.5x IC50) for 48 h. Loading control: β-Actin. Bands were quantified and results are shown as the ratio between the cleaved/full length protein; *p<0.05, **p<0.01 vs. control. D: Immunoblots for full length and cleaved caspase 9 as well as full length and cleaved PARP in total cell protein extracts from HCT15 colon cancer and A549 lung cancer cells treated with escalating concentrations of EGCG (0.5x, 1x and 1.5x IC50) for 48 h. The control sample labeled as “0” refers to untreated control. Loading control: β-Actin. Bands were quantified and results are shown as the ratio between the cleaved/full length protein; *p<0.05, **p<0.01 vs. control.