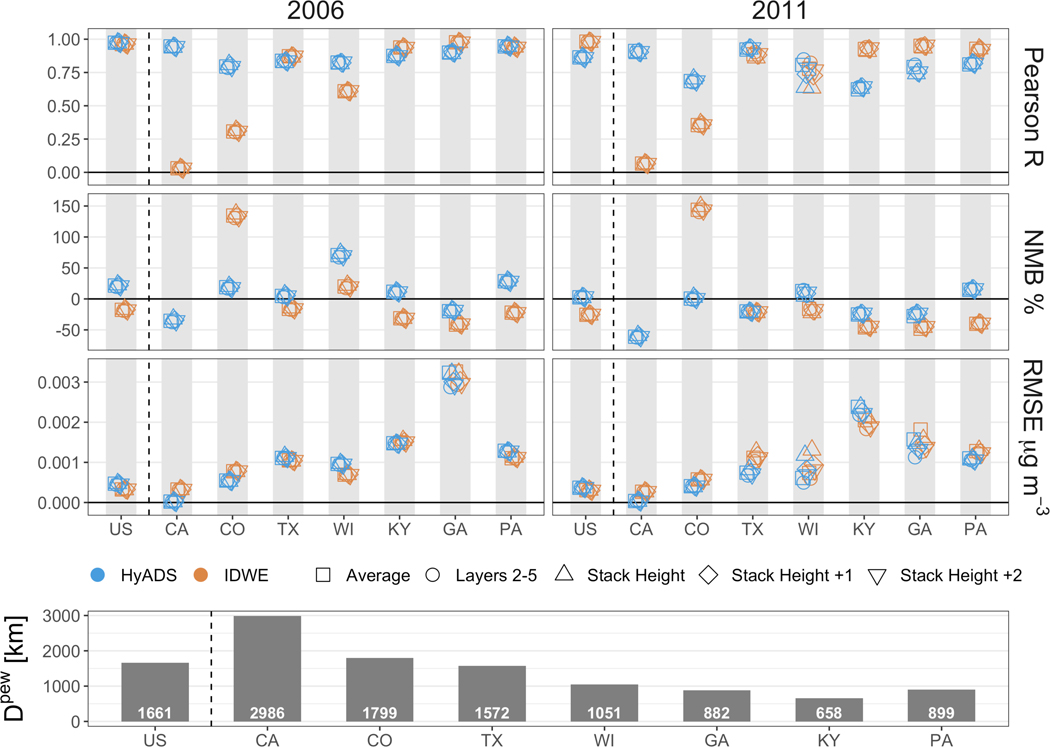
Figure 3.
Top: Linear correlation (Pearson R), Normalized Mean Bias (−100% < NMB < +∞) and root mean square error (RMSE) evaluations of and source impacts evaluated against in individual states and entire United States (US). NMB for in CA and CO are removed because they are many times higher than the scale of the results in other states (the removed values range from 1,000% to 1,800%. Bottom: Population and emissions weighted distance (Dpew, defined in Equation 5) for individual states and the entire United States.

