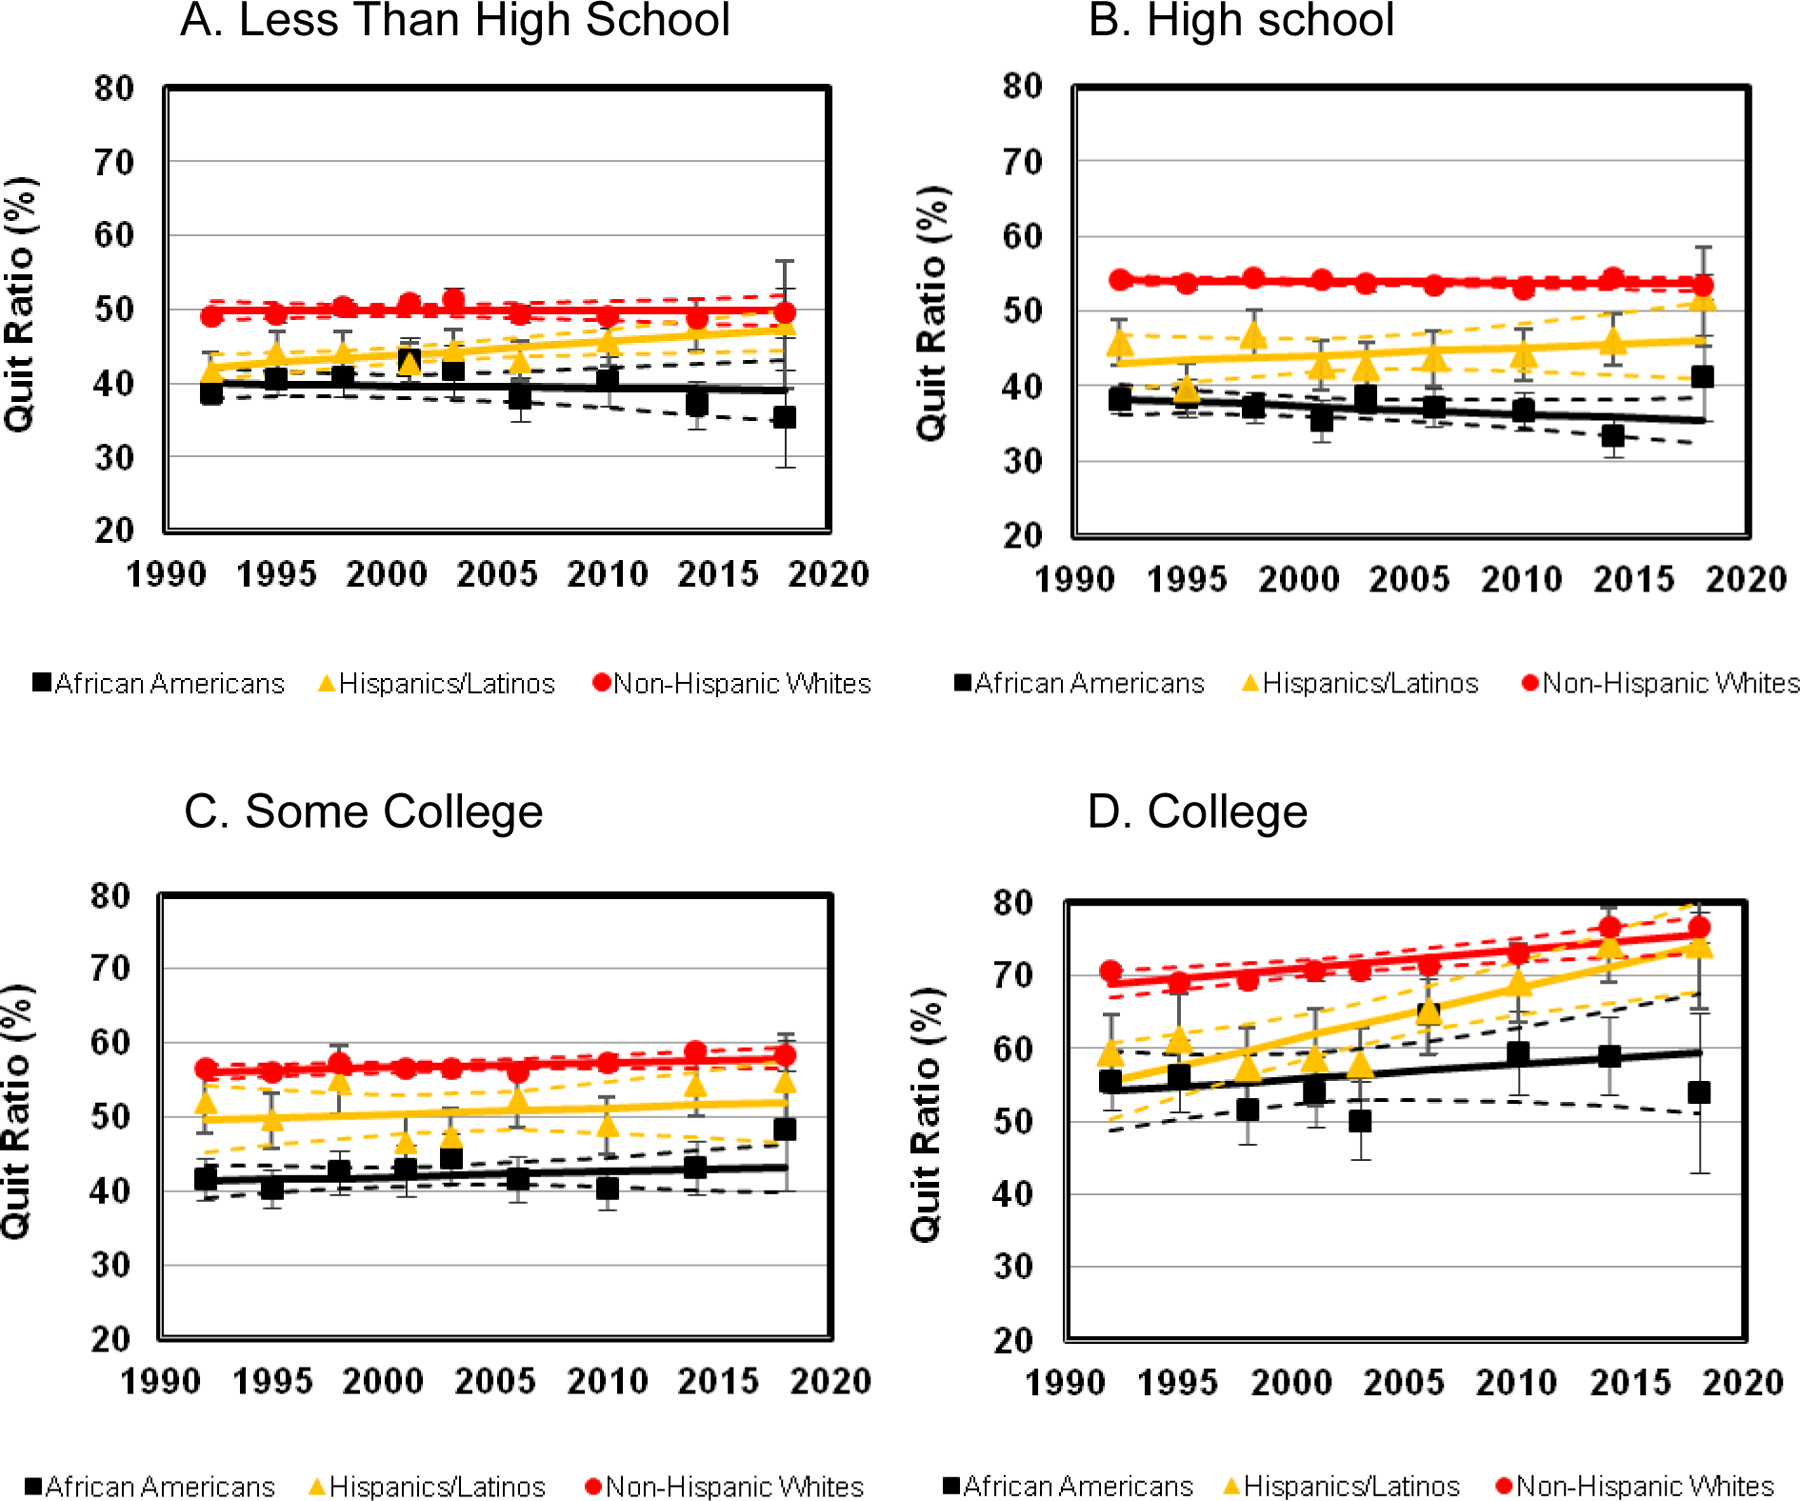
Figure 4.

Quit Ratios and Trend Lines by Race/Ethnicity across Education Level (25+ years old) based on Tobacco Use Supplement-Current Population Surveys (TUS-CPS) in the United States, 1992/93–2018. Stratification of quit ratios was by education levels, where Panel A represents the percentage of smokers who quit with less than a high school education, Panel B represents the percentage who graduated high school, Panel C represents the percentage with some college education, and Panel D the represents the percentage who graduated college. The x-axis represents each TUS-CPS, and the y-axis is the percentage of the population (age 25+) who has quit smoking. Solid lines are the trend lines of the point estimates, where squares represent African Americans, triangles for Hispanics/Latinos, and circles for non-Hispanic Whites. Dotted lines are the 95% confidence intervals for each trend line.
