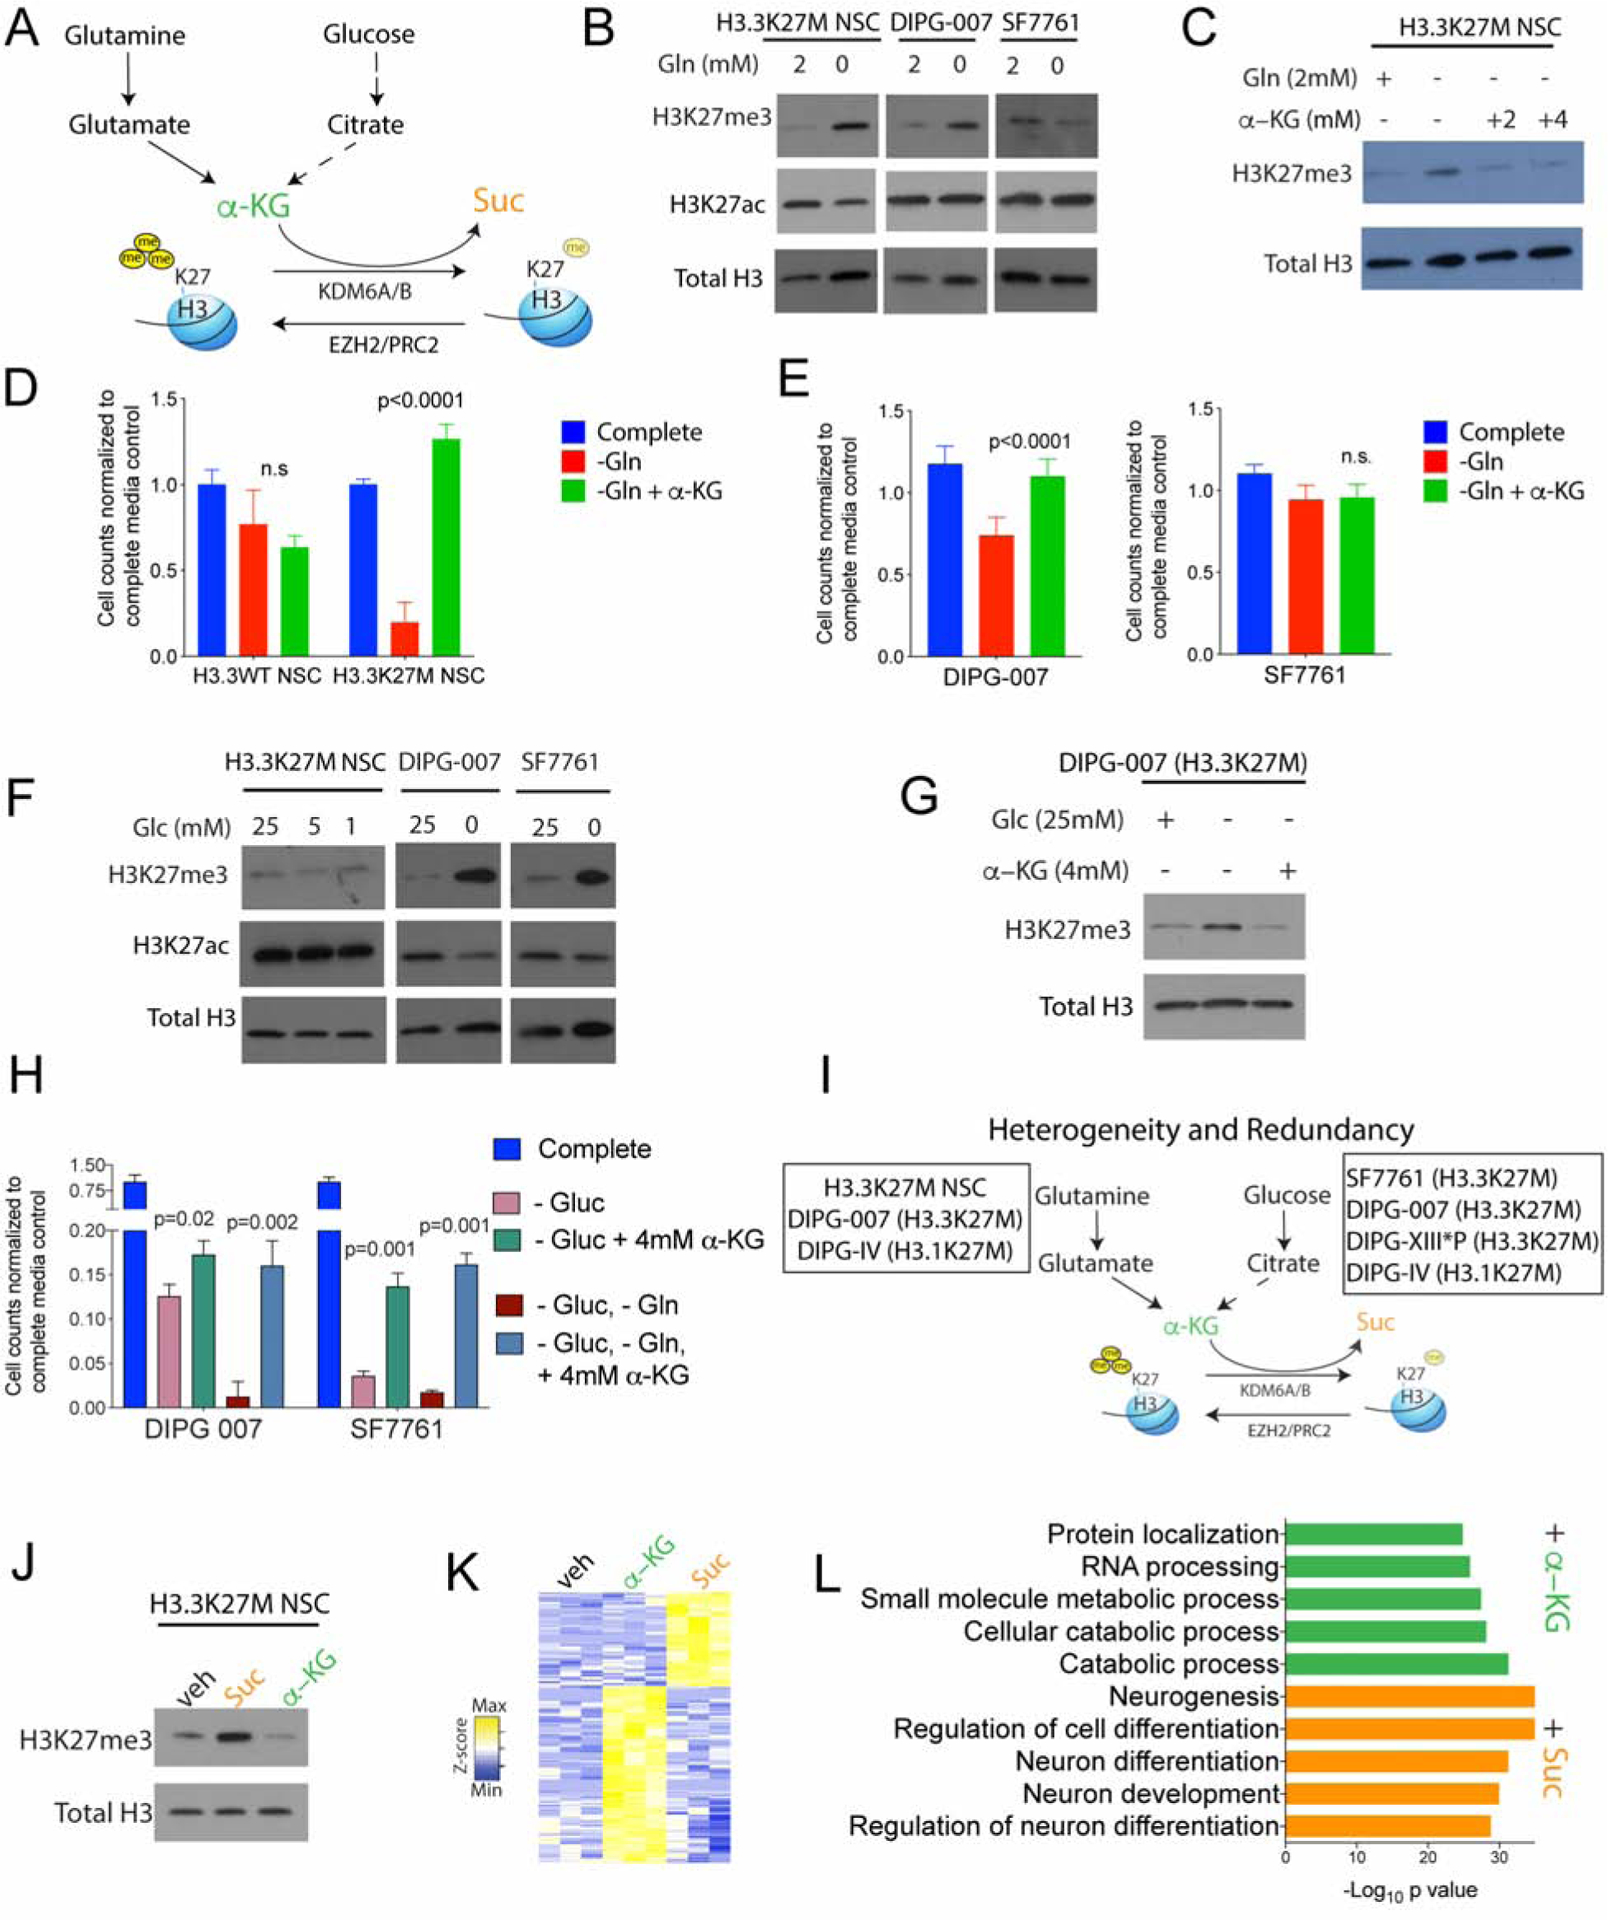
Figure 3. Heterogeneous regulation of global H3K27me3 levels by glutamine and glucose metabolism in H3.3K27M cells.

(A) Schematic depicting α-KG generation from glutamine and glucose metabolism: α-KG can promote H3K27me3 demethylation by serving as a critical co-factor for the H3K27 demethylases KDM6A/6B and is metabolized to succinate (Suc) during this reaction.
(B) H3.3K27M cells (H3.3K27M NSC, DIPG-007 and SF7761) were grown in complete or glutamine (Gln)-depleted media. Representative WB demonstrate changes in global H3K27me3 and H3K27ac in relation to total H3.
(C) Representative WB of H3.3K27M NSC showing alterations in global H3K27me3 levels in relation to total H3 in Gln-depleted media with/without 2 or 4mM cell-permeable α-KG.
(D–E) Cell counts (Y-axis) on Gln withdrawal with/without 4 mM cell-permeable α-KG in H3.3WT and H3.3K27M NSC (d), DIPG-007 and SF7761 (e) cells (n=4).
(F) H3.3K27M cells (H3.3K27M NSC, DIPG-007 and SF7761) were grown in complete or glucose (Glc)-depleted media. Representative WB demonstrates changes in global H3K27me3 and H3K27ac and total H3.
(G) Representative WB of H3.3K27M DIPG-007 cells showing changes in H3K27me3 levels in relation to total H3 in Glc-deprived media with/without 4 mM cell-permeable α-KG.
(H) Cell counts (Y-axis) in H3.3K27M DIPG-007 and SF7761 cells upon withdrawal of Glc, Gln or both with/without 4 mM cell-permeable α-KG (n=4).
(I) Schematic indicating heterogeneity and redundancy in the regulation of global H3K27me3 by glutamine (H3.3K27M NSC, DIPG-007 and DIPG-IV) and glucose (SF7761, DIPG-007, DIPG-XIII*P and DIPG-IV) metabolism in H3.3 and H3.1 K27M cell lines (see figure S3 for other cell lines).
(J) H3.3K27M NSC were treated with vehicle or 4 mM cell-permeable Suc or α-KG. Representative WB illustrating H3K27me3 in relation to total H3 levels.
(K–L) Heatmap of differentially regulated genes (K) and GSEA analysis of upregulated genes (L) in H3.3K27M NSC treated with α-KG or Suc (4 mM, n=3).
All experiments were conducted after 4 days in culture. WB are representative; n indicates biologic replicates; Data plotted as mean ± SD and analyzed by ANOVA.
