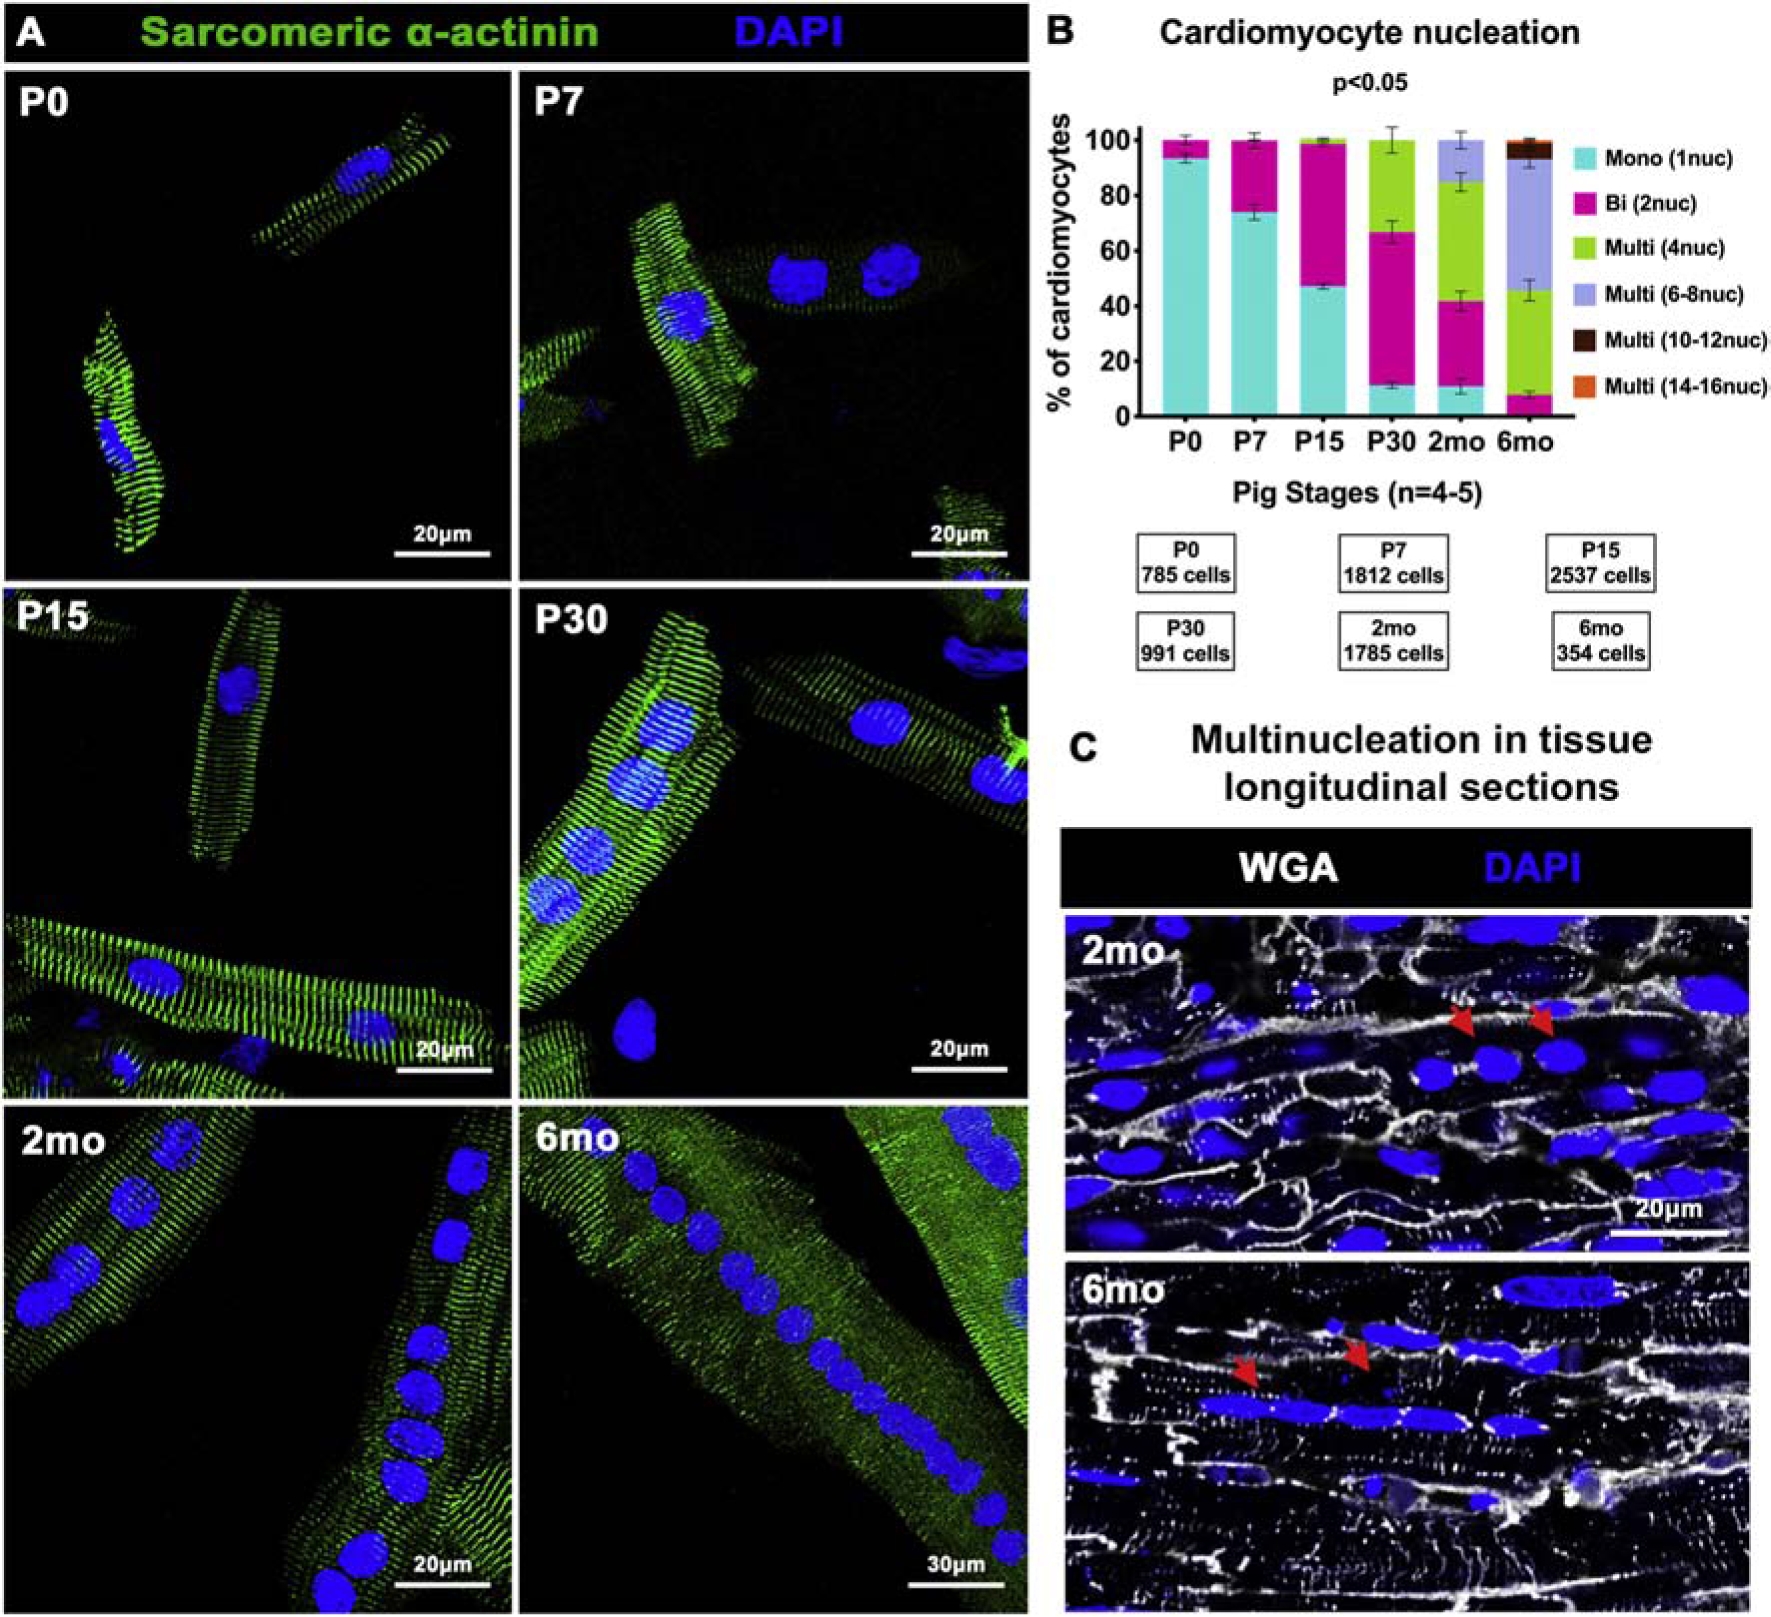
Figure 2. Postnatal pig CMs exhibit progressive multinucleation from P15–6mo, with significant mononucleation until P15.

(A) Representative images of pig dissociated CMs from P0 to 6mo showing nucleation by DAPI staining (blue), with CMs identified by sarcomeric α-actinin (green). (B) Percentage of total CMs exhibiting mono-, bi-, and multi-nucleation per stage calculated by manual nucleation counts. (C) Representative images of multinucleated CMs (red arrows), via WGA staining in longitudinal sections of pig left ventricular tissue. Data are mean ± SEM, with p<0.05 determined by Dunn’s Kruskal-Wallis Multiple Comparisons Test in n=4–5 pigs per stage.
