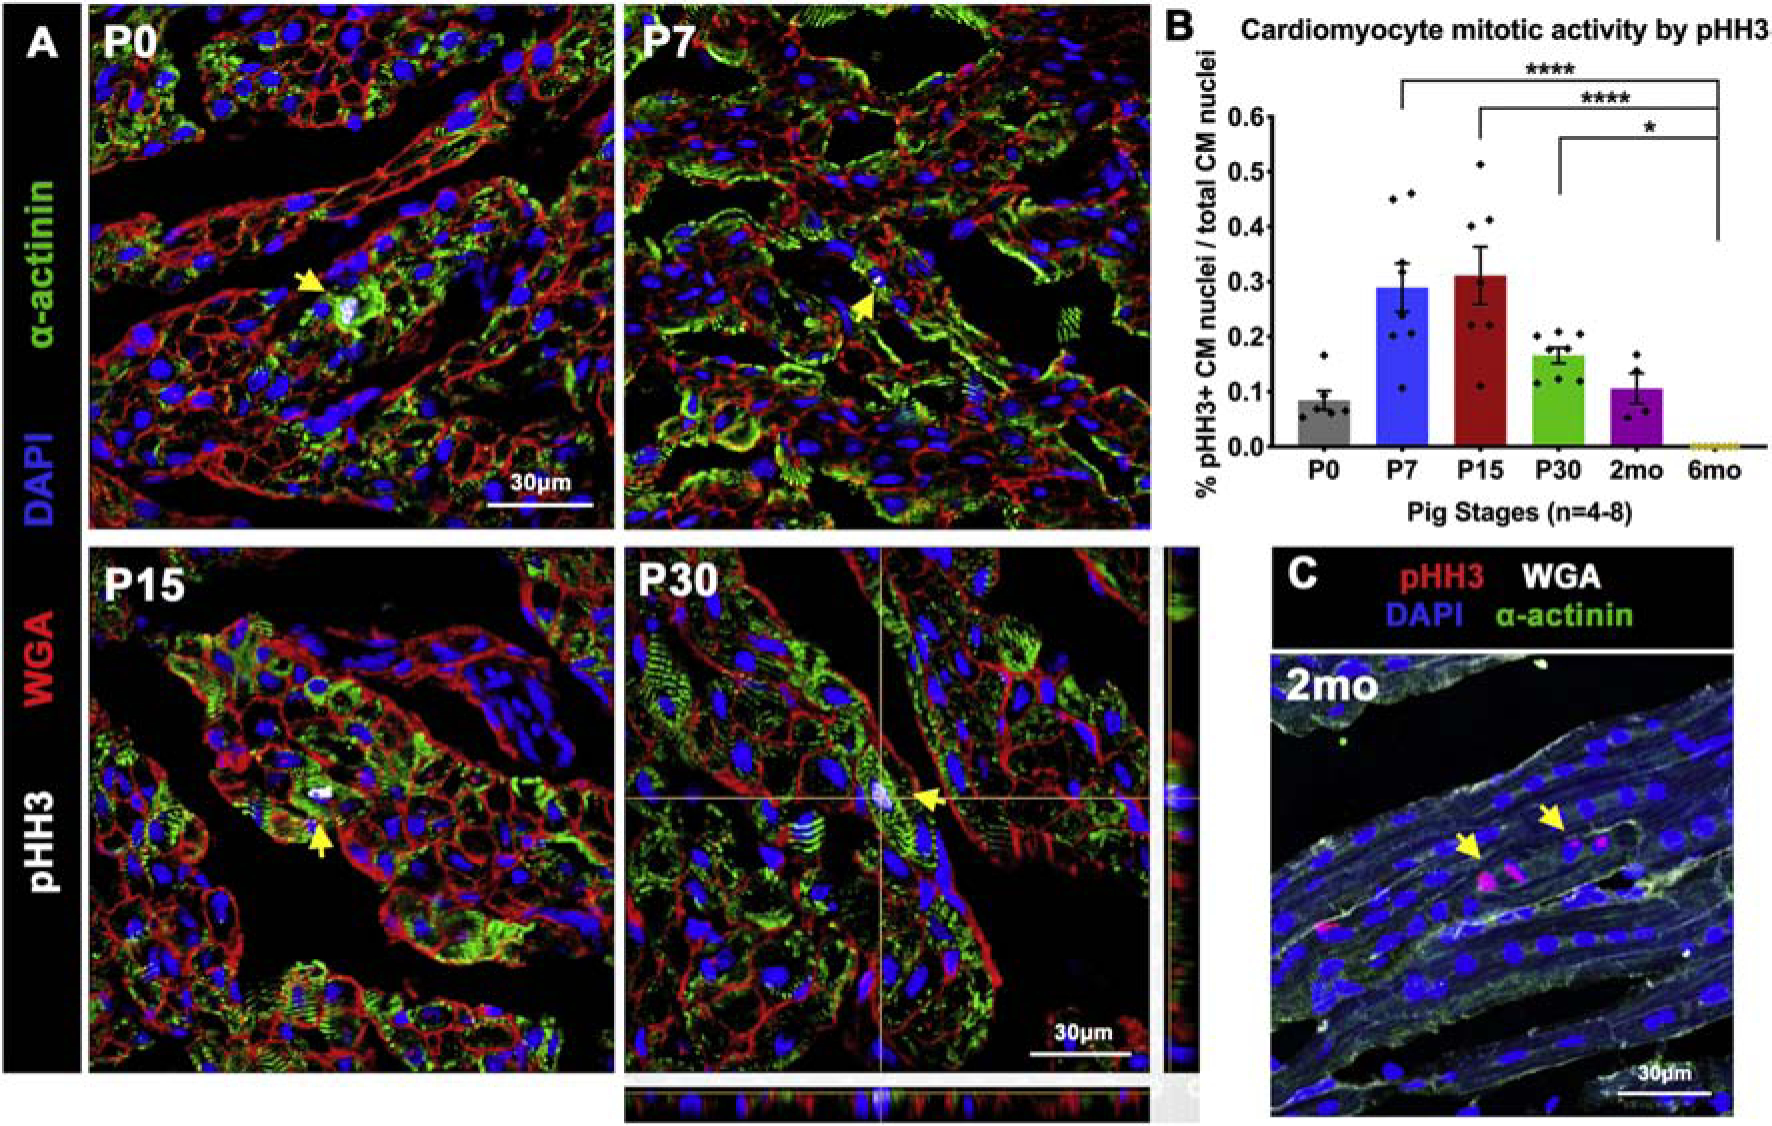
Figure 3. CM mitotic activity is detected up to 2mo in postnatal pig hearts.

(A) Representative images of Phosphohistone-H3 (pHH3) staining for mitotic activity (yellow arrows) in pig heart tissue sections, with CMs identified by sarcomeric α-actinin. P30 image showing representative Z-stack planes indicates the analysis method used to accurately identify CMs at all stages. (B) Representative longitudinal tissue section showing multinucleated CM with simultaneous pHH3 activation in adjacent nuclei (yellow arrows). (C) Ratio of pHH3-positive CM nuclei to total CM nuclei was calculated in cardiac cross-sections. Data are mean ± SEM, with *p<0.05, **p<0.01, ***p<0.001, ****p<0.0001 determined by Dunn’s Kruskal-Wallis Multiple Comparisons Tests in n=4–8 pigs per stage.
