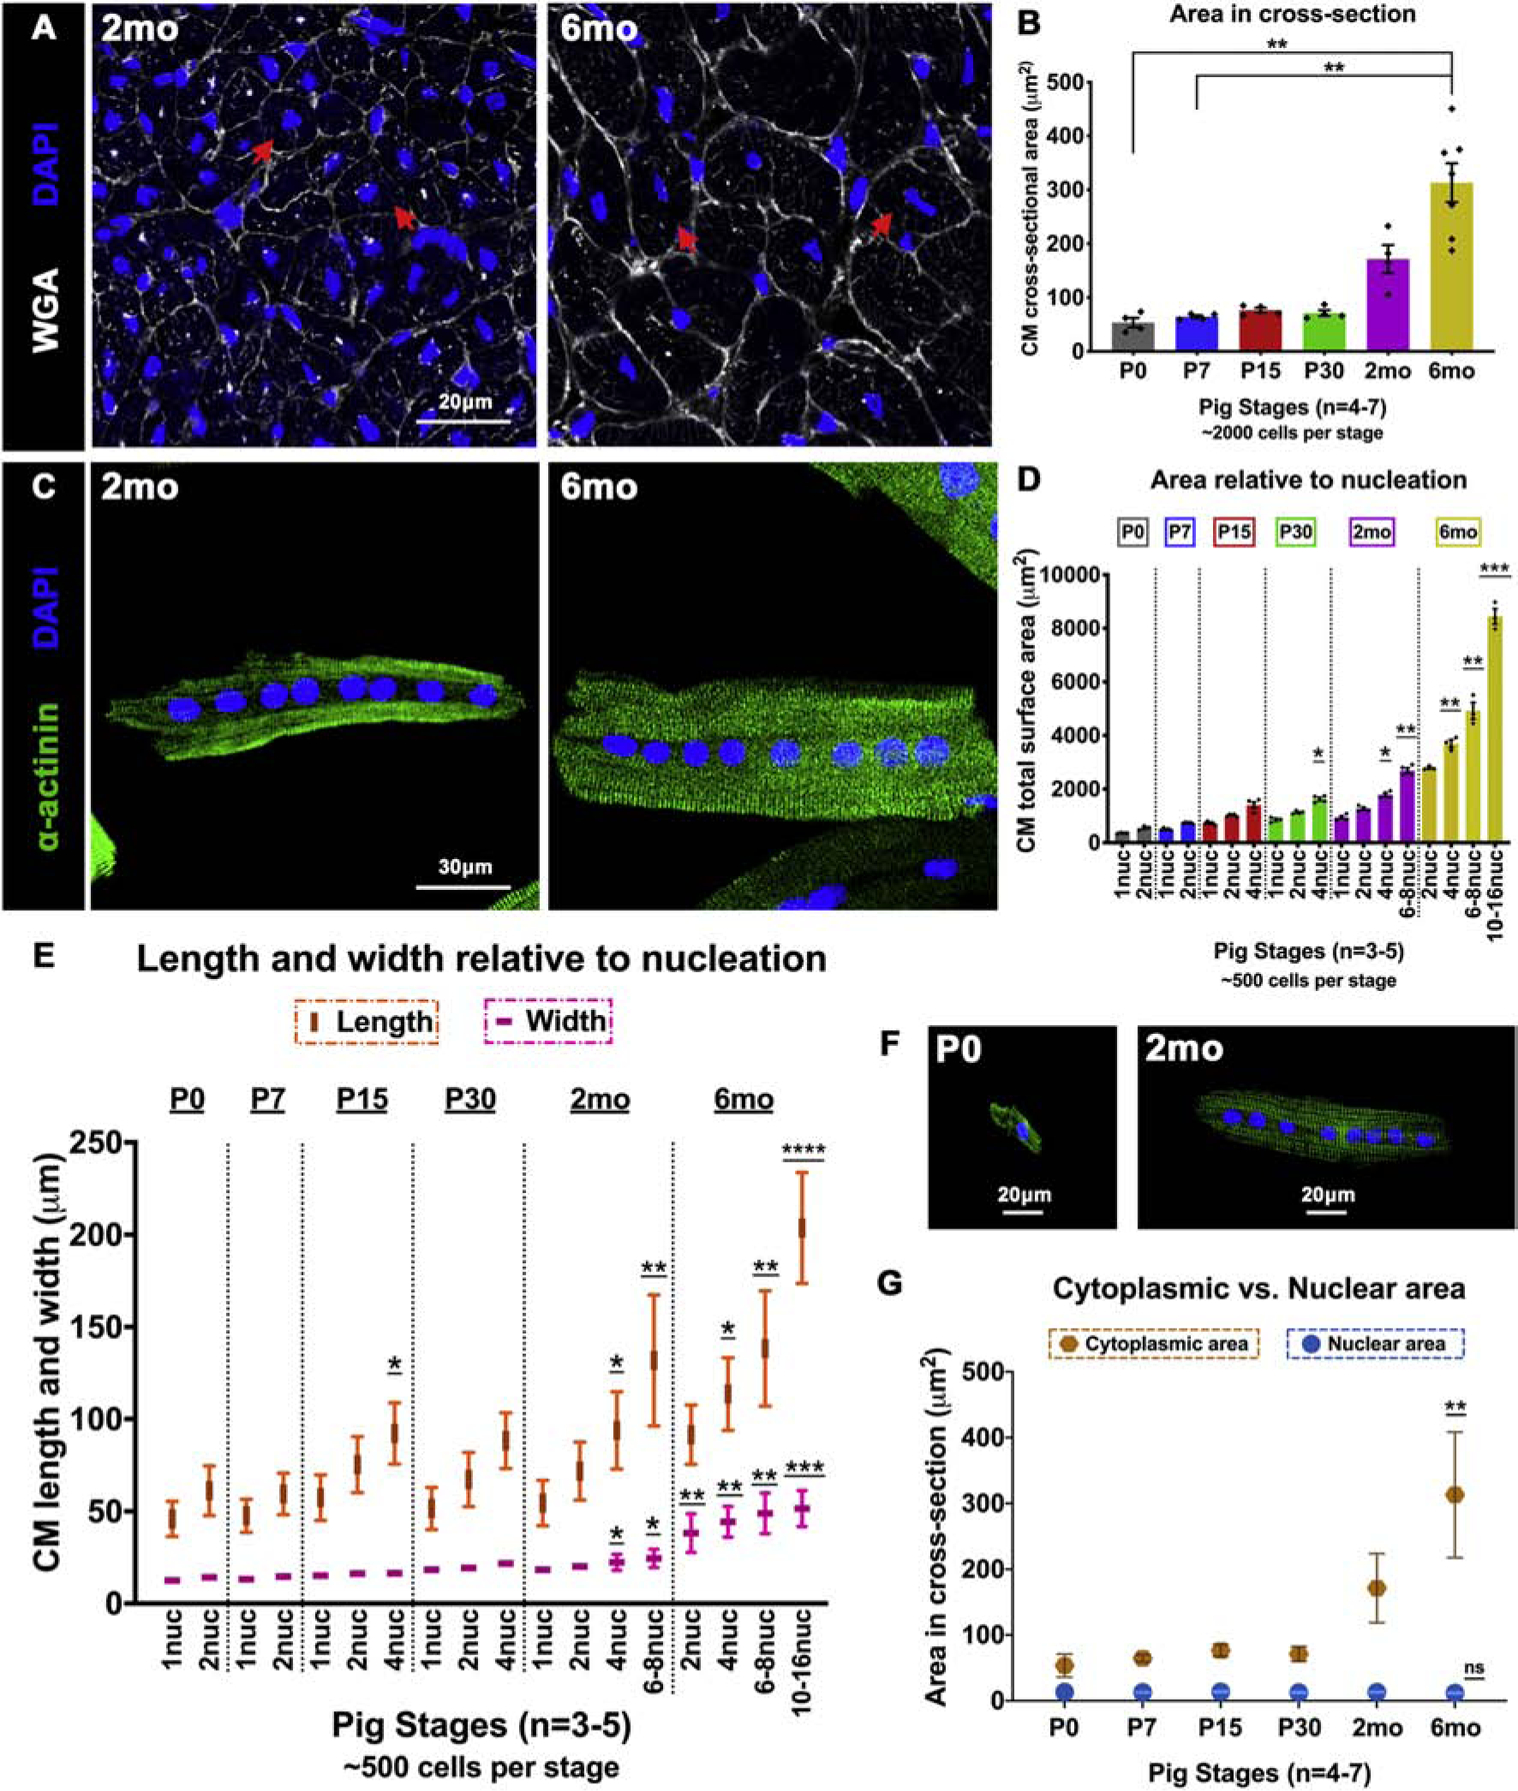
Figure 5. CM length increases relative to nucleation beyond while CM width does not increase until 2mo-6mo in postnatal pigs.

(A) Representative images of pig heart cross-sections stained with WGA and DAPI at 2mo and 6mo. Red arrows indicate increase in CM cross-sectional cell size. (B) CM cross-sectional area (μm2) in paraffin sections was quantified by manual cell tracing based on WGA staining. (C) Representative images of dissociated pig CMs showing increased size between octanucleated cells at 2mo and 6mo. (D) Total surface area (μm2) was measured by manual cell tracing of dissociated CMs based on α-actinin staining. (E) Length and width were assessed in dissociated pig CMs by manual measurements. (F) Representative images of change in CM length relative to nucleation at P0 and 2mo. (G) Nuclear area based on DAPI staining was measured and compared against cytoplasmic area measured by cell tracing in WGA-stained paraffin cross-sections. Data are mean ± SEM in B and D, and mean ± SD in E, with *p<0.05, **p<0.01, ***p<0.001, ****p<0.0001 determined by Dunn’s Kruskal-Wallis Multiple Comparisons Tests. Asterisk(s) with underline indicate significance compared to mononucleated P0 CM (P0–1nuc) in D and E. In G, data are mean ± SD, with **p<0.01 and ns=not significant determined compared to P0 by Brown-Forsythe and Welch ANOVA tests with Games-Howell corrections for Multiple Comparisons, in n=3–7 pigs per stage.
