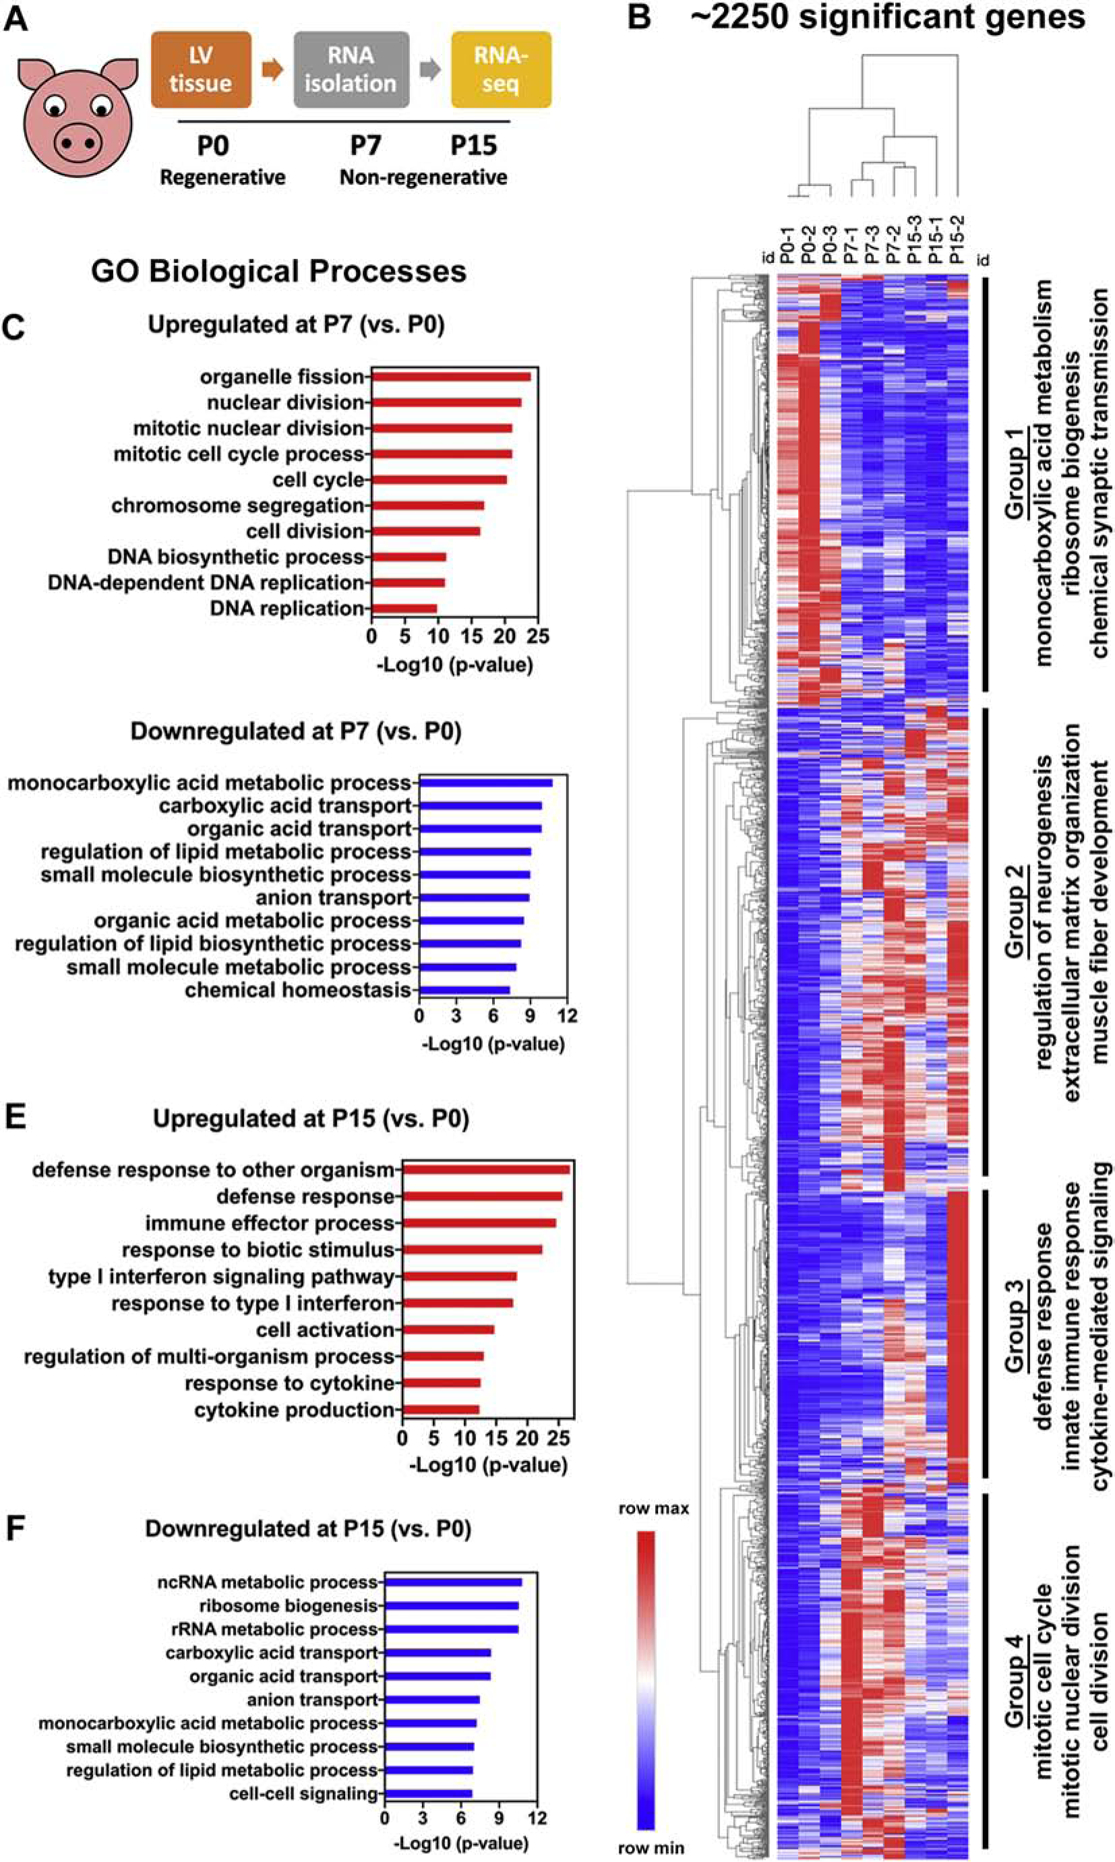
Figure 6. RNAseq indicates upregulation of cell cycling at P7 and immune signaling at P15, alongside downregulation of carboxylic acid metabolic processes, in postnatal swine.

(A) Schematic of RNAseq experimental design. (B) Heatmap showing 2253 significantly differentially expressed genes between P0, P7, and P15, categorized into four groups based on GO-biological process (BP) terms. (C, D) Top GO-BP terms for significantly upregulated and downregulated genes at P7 compared to P0 (P7 vs. P0). (E, F) Top GO-BP terms for significantly upregulated and downregulated genes at P15 compared to P0 (P15 vs. P0). Significant differentially expressed genes were obtained using a fold change cutoff of 2 and adjusted p-value≤0.05, in n=3 pigs per stage.
