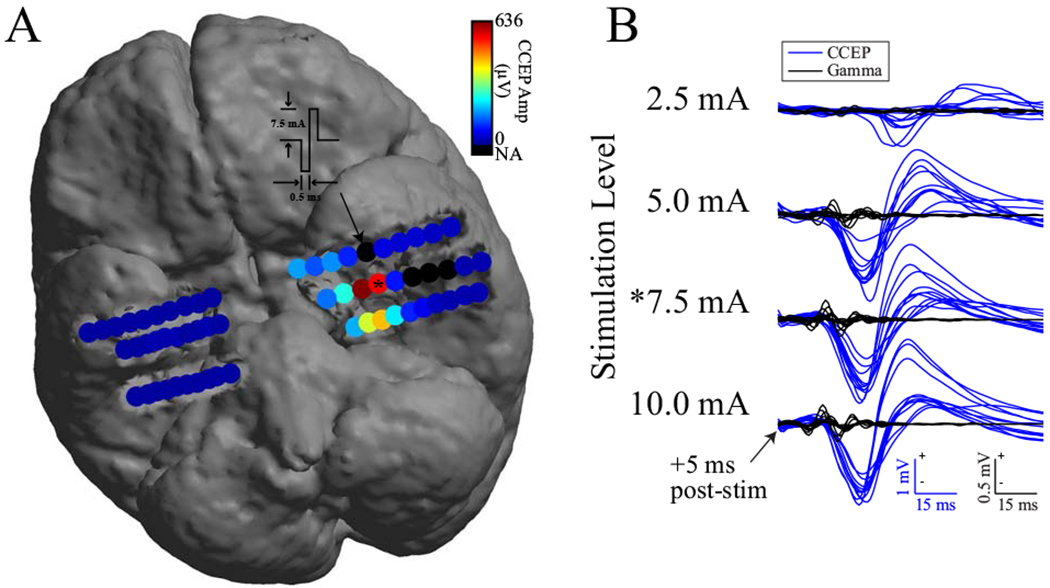
Figure 1.

CCEP response pattern to SPES and single-trial CCEPs and gamma responses across levels. (A) CCEP responses to SPES at 7.5 mA on electrode #5 (denoted by arrow) in left amygdala of patient 3 showing spread to anterior and posterior hippocampal leads. Color indicates mean absolute value of trial average CCEPs from 5 to 100 ms post-stimulation. Black electrodes contained artifact or were disabled. Responses remained ipsilateral to the location of stimulation in this example. (B) Single-trial CCEPs (blue) and gamma responses (black) recorded at 4 stimulation levels on electrode #4 in left hippocampus after SPES on electrode #5 in left amygdala. Asterisk indicates same CCEP data (electrode and level) between A and B. Polarity of voltage or power is marked on figure scale, + is up.
