
Figure 2.
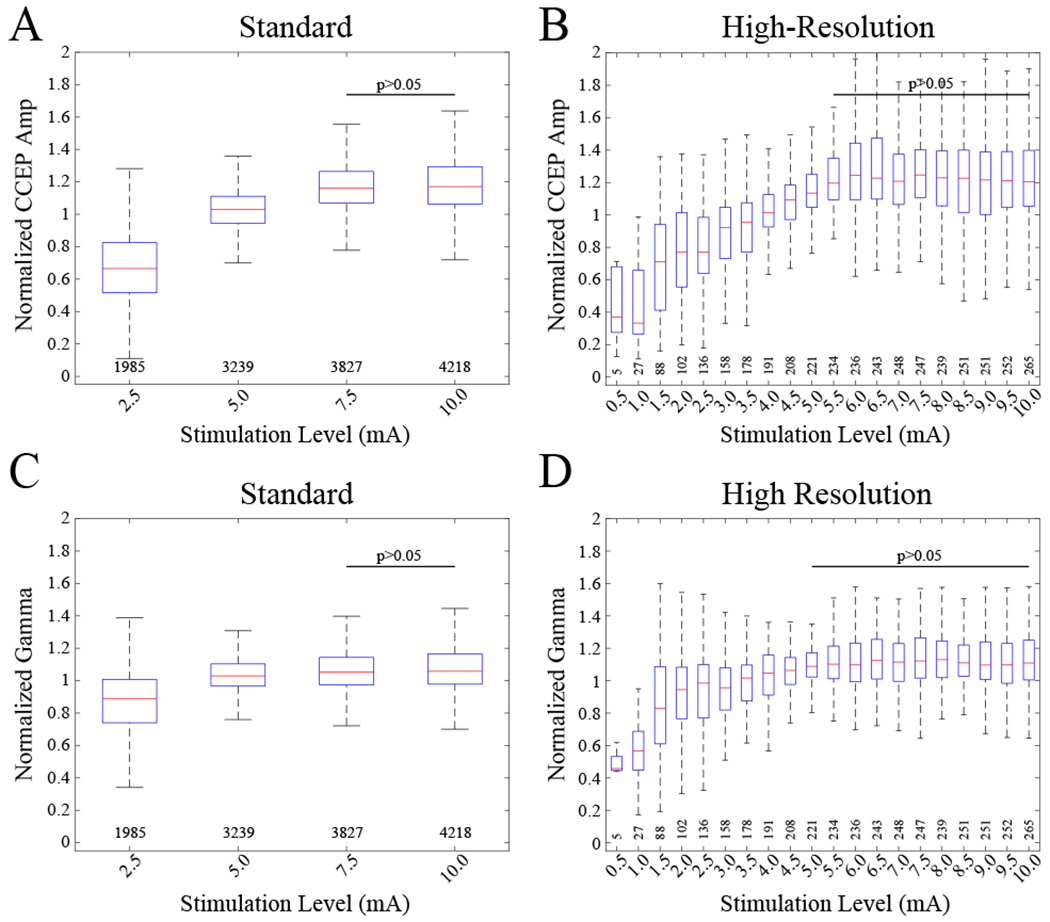
Normalized CCEP amplitude and gamma power (70-150 Hz) as a function of stimulation level. Boxplots indicate normalized medians, interquartile ranges, and extremes at each level. Normalization was performed by dividing each value by the mean across levels for each unique stimulation-response electrode pair. (A) Normalized CCEP amplitudes across 4 stimulation levels for 7 patients. Raw amplitudes had medians (ranges) of 62 (4-2138), 111 (7-2784), 128 (16-3545), 128 (15-3194) μV for each of the levels, respectively. CCEPs are from 387 stimulated electrodes in amygdala and hippocampus as well as neocortex and white-matter regions of the brain. The number of CCEPs at each level is indicated below each boxplot. Omnibus KW test shows main effect of stimulation amplitude (χ2=4.97*103, df=3, p=0). No difference was found between CCEPs at 7.5 and 10 mA. All other pairwise combinations were significantly different (pairwise rank-sum tests, p<0.05). (B) Omnibus KW test confirms main effect of stimulation amplitude (χ2=999, df=19, p=7.36*10−200). CCEP amplitudes across 20 stimulation levels for 6 patients. CCEPs are from 22 stimulated electrodes in amygdala and hippocampus as well as frontal and white-matter regions of the brain. No difference was found for all pairwise combinations of CCEPs at ≥5.5 mA. A trend of decreasing CCEP amplitude for lower values and a plateau-effect for higher values begins at ~5.0 mA. (C) Normalized gamma power across levels for the standard dataset. Omnibus KW test confirms main effect of stimulation amplitude (χ2=1.37*103, df=3, p=3.27*10−297). No difference was found between 7.5 and 10.0 mA for the “standard” and all pairwise combinations of ≥5.0 mA for the “high-resolution” datasets. (D) Normalized gamma power across levels for the “high-resolution” dataset. Omnibus KW test confirms main effect of stimulation amplitude (χ2=377, df=19, p=2.39*10−68). A plateau-effect begins at ~5.5 mA similar to CCEP amplitude.