
Figure 3.
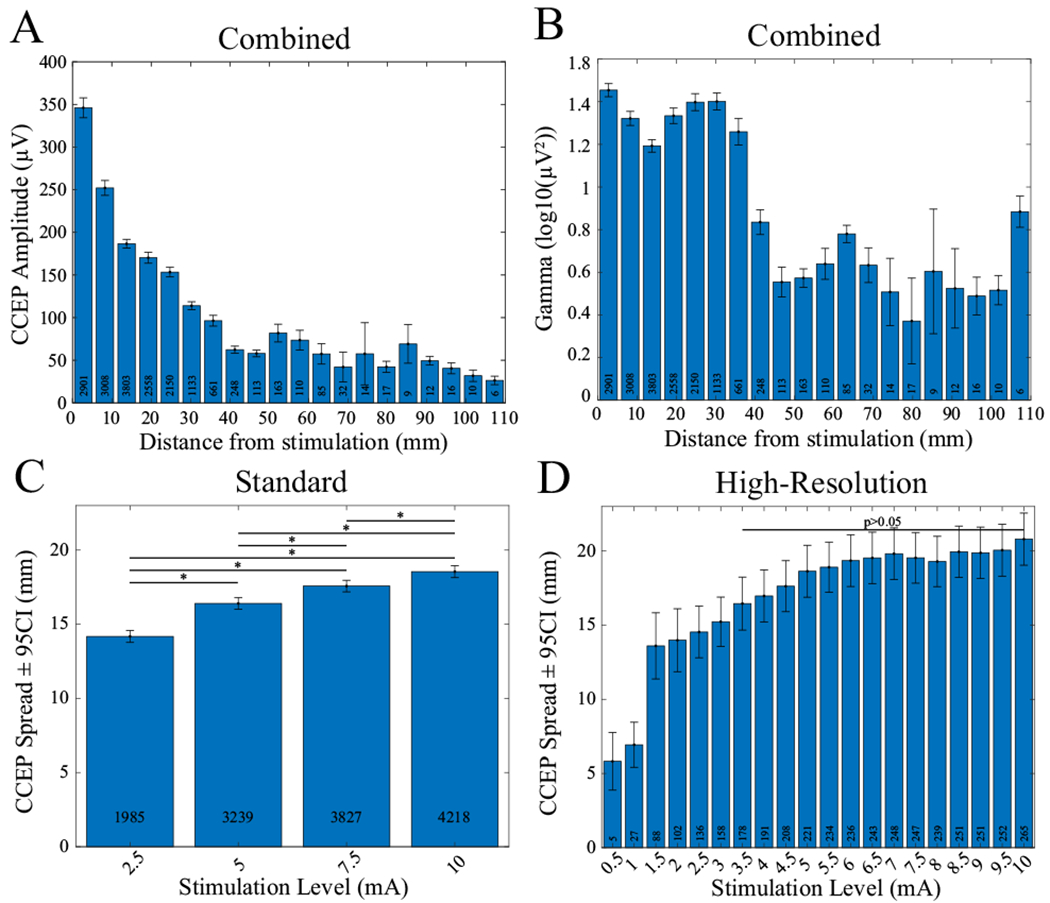
CCEP amplitude and gamma power as a function of distance. (A) CCEP amplitude versus distance from stimulation combined across all patients and all stimulation levels. A steady decrease in amplitude occurs until ~50 mm. (B) Gamma-band power versus distance across all patients and all stimulation levels. An abrupt drop in power occurs at ~35 mm. (C, D) Spatial spread of CCEPs as a function of stimulation level. Error bars indicate 95% confidence. White boxes indicate total count per bin. C) Mean distance from stimulated electrodes to detected CCEPs across 4 levels and 7 patients. CCEPs are from 387 stimulated electrodes. Distance increases with each level (p<0.05). Significant pairwise comparisons are indicated with an asterisk. Mean distances (ranges) for each level are 14.2 (2.4-95.3), 16.4 (2.4-108.1), 17.6 (2.4108.1), 18.5 (2.4-108.1) mm, respectively. (D) Mean distance from stimulated electrodes to detected CCEPs across 20 levels and 6 patients. CCEPs are from 22 stimulated electrodes. No difference was found for all pairwise combinations of levels ≥3.5 mA. A transition to a plateau occurs at ~5.5 mA similar to CCEP amplitude versus level in Figure 2. A discontinuity occurs between 1 and 1.5 mA. This is because CCEPs at levels <1.5 mA primarily occurred on adjacent electrodes with spacings of ≤5 mm. The range of distances across all levels was 3.5-67.2 mm.