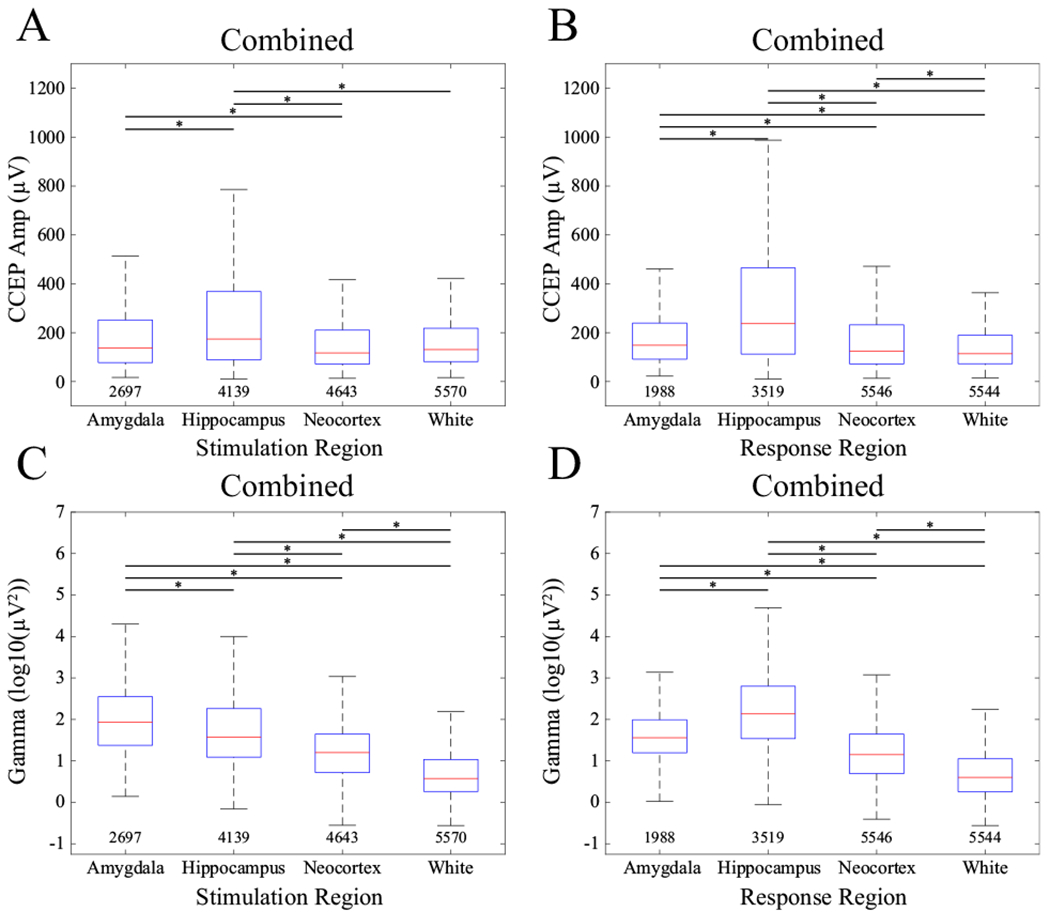
Figure 5.

CCEP amplitude (A, B) and gamma power (C, D) comparisons by region of stimulation (A, C) and region of response (B, D). Asterisks show pairwise significance (pairwise rank-sum tests, p<0.05, Tukey-Kramer corrected). Numbers below each boxplot indicate count. Data were combined across all stimulation levels and all patients.
