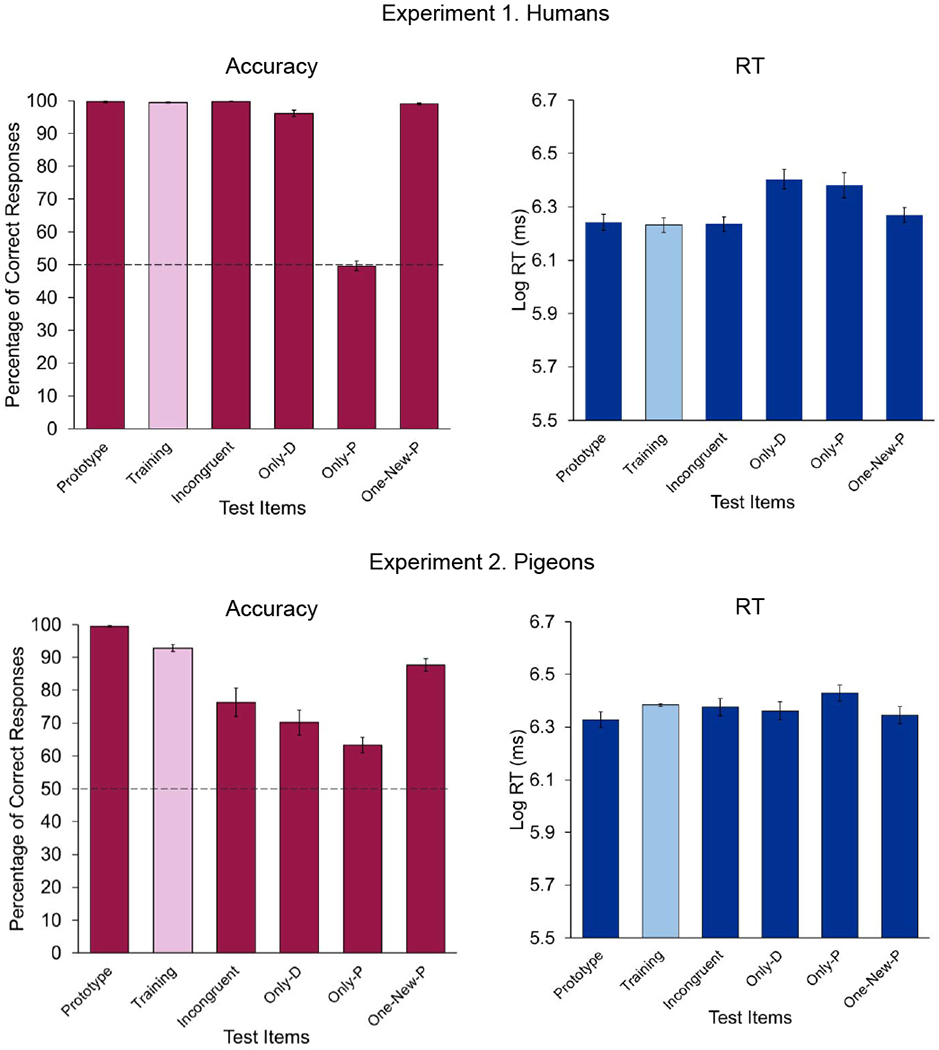
Figure 2.

Mean percentage of correct responses (left) and reaction times (right) to the different types of testing trials in Experiment 1, with humans (top), and in Experiment 2, with pigeons (bottom). In the case of Incongruent trials, responses based on the deterministic feature were considered to be correct. The dashed line, at 50%, represents the chance level. Error bars indicate the standard error of the means.
