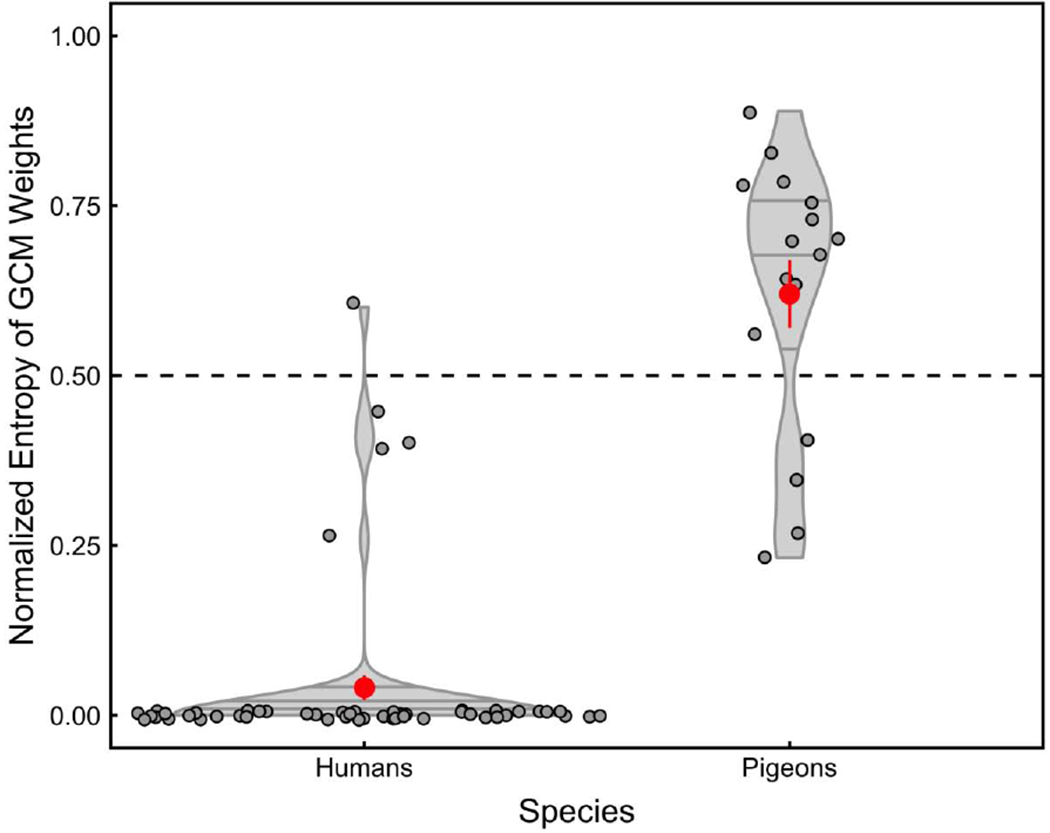
Figure 3.

Normalized entropy of GCM’s best-fitting attentional weights for each individual subject. The violin plots depict the density distributions of normalized entropy for both species when the deterministic feature was presented either in the center or on the side of the category exemplar. A value of 0 represents maximal selectivity (when the attentional weight for one of the features equals 1 and the remaining weights for all other features equals 0), whereas a value of 1 represents minimal selectivity or maximal distribution of attention (when all weights are equal). The red points indicate the mean of each of the distributions. The dashed line, at 0.50, represents the middle value and is simply included as a reference.
