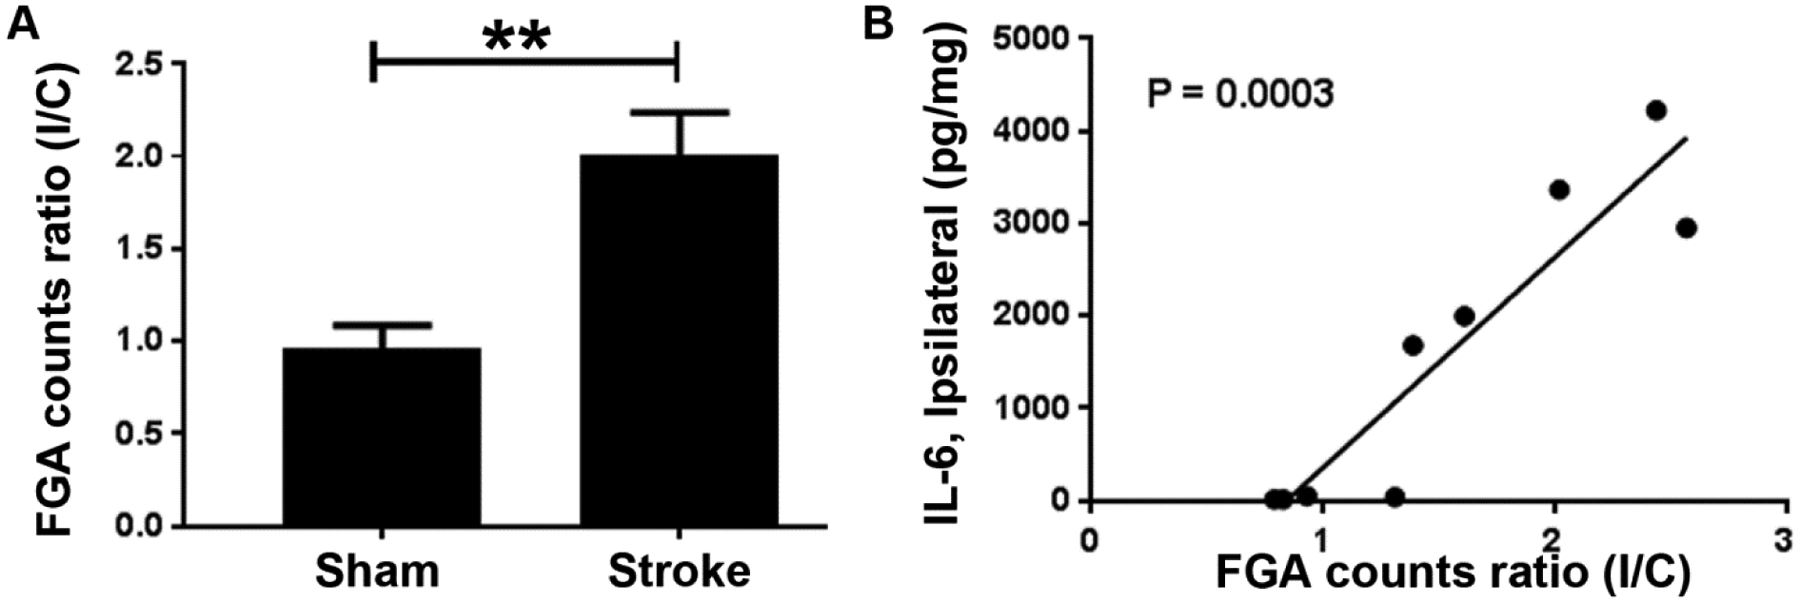
Figure 4:

Accumulation of FGA in the brain stroke. (A) Ipsilateral to contralateral ratio (I/C) of FGA counts in stroke mice (n = 5) is almost twice as high as in sham mice (n = 4). (B) Correlation of FGA I/C ratio with IL-6 levels in ipsilateral tissue (n = 4 from sham group and n = 5 from stroke group).
