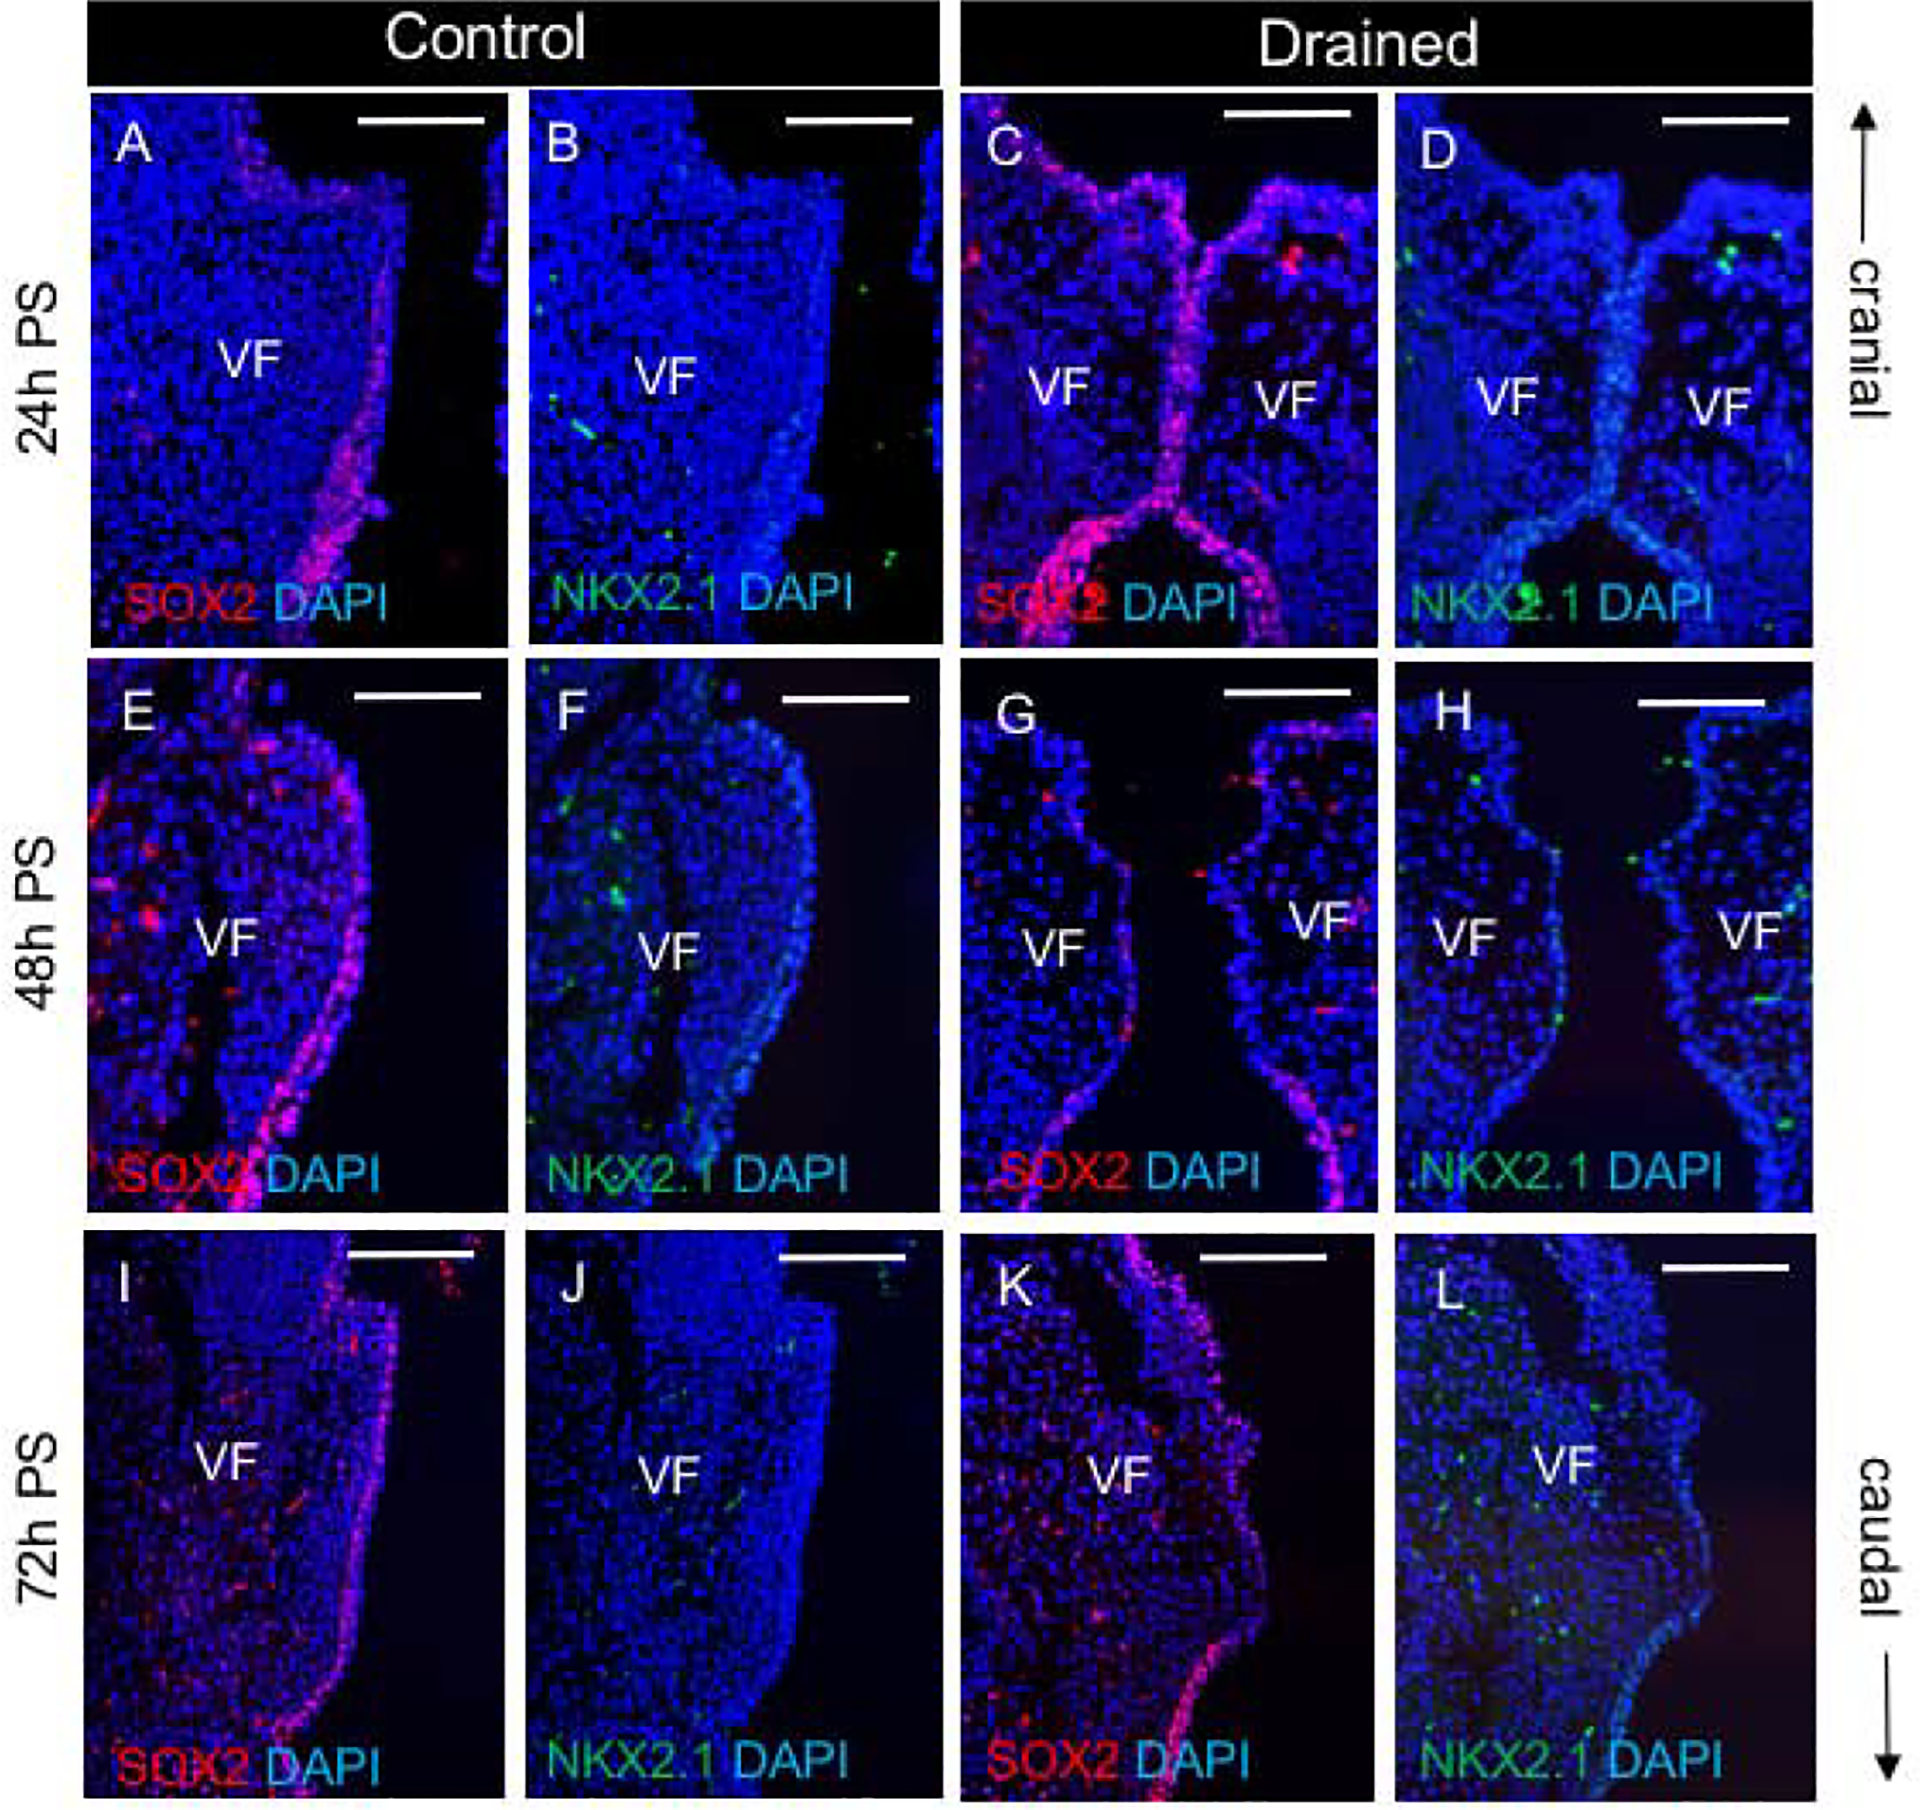
Figure 4: Changes in SOX2 and NKX2.1 expression during EL recanalization.

(A-D) Double staining for SOX2(red) and NKX2.1 (green) in control (A, B) and drained embryos (C, D). (E-H) Double staining for SOX2 (red) and NKX2.1 (green) in control (E, F)) and drained embryos (G, H)) showing downregulation of SOX2 in drained embryos 48h PS. (I-L) Double staining for SOX2 (red) and NKX2.1 (green) in control (I,J) and drained embryos (K,L) showing re-established SOX2 expression in drained vocal folds at 72h PS. Scale bar = 100μm. Abbreviations: h, hour; PS, post-surgery; VF, vocal fold.
