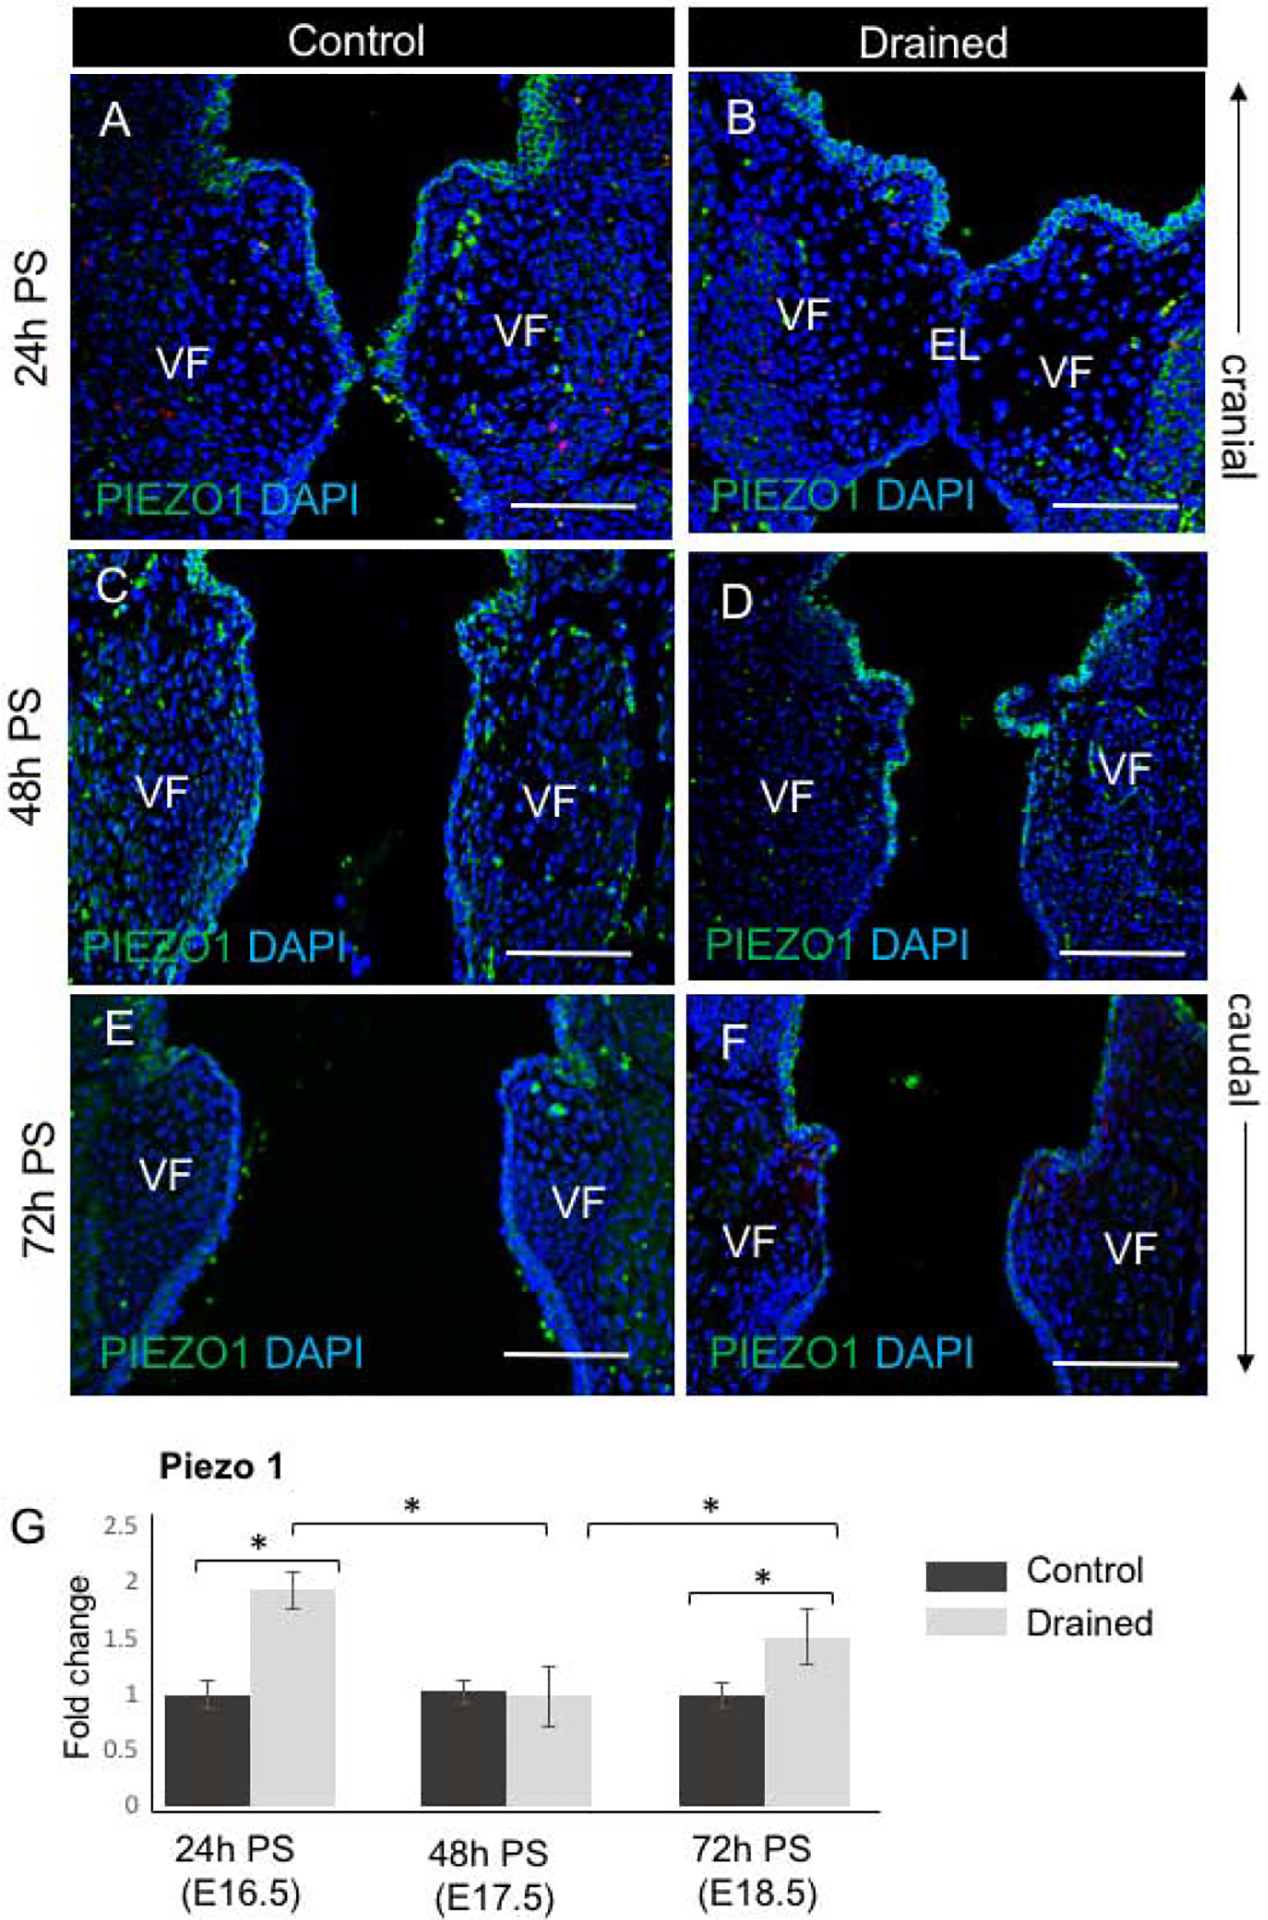
Figure 7: Piezo 1 expression during the EL recanalization.

(A - F) Characterization of Piezo 1 expression (in green) in VF epithelial cells during the EL recanalization in control VF (A, C, E) and drained VF (B, D, F) 24h, 48h and 72h PS, respectively. Strong Piezo 1 staining was detected particularly in drained embryos 24h and 48h PS. Scale bar = 100μm. Abbreviations: EL, epithelial lamina; h, hour; PS, post-surgery; VF, vocal fold. (G) mRNA expression levels of Piezo 1 in control and drained VF 24h, 48h, and 72h PS. For qPCR analysis, control embryos collected at each time point were used as controls for ΔΔCT data normalization. Data are presented as the average of two biological replicates (n=6) ± standard error of the mean, as three mouse larynges were combined for one biological replicate to maximize RNA yield. A Student’s T test, ANOVA and a post hoc Tukey test were performed to calculate significance in the gene expression levels between control and drained embryos at each time point. A p-value < 0.05 (*) was considered significant.
