

Abstract
Glycosyltransferases (GTs) are widely present in several organisms. These enzymes specifically transfer sugar moieties to a range of substrates. The processes of bacterial glycosylation of the cell wall and their relations with host–pathogen interactions have been studied extensively, yet the majority of mycobacterial GTs involved in the cell wall synthesis remain poorly characterized. Glycopeptidolipids (GPLs) are major class of glycolipids present on the cell wall of various mycobacterial species. They play an important role in drug resistance and host–pathogen interaction virulence. Gtf3 enzyme performs a key step in the biosynthesis of triglycosylated GPLs. Here, we describe a general procedure to achieve expression, purification, and crystallization of recombinant protein Gtf3 from Mycobacterium smegmatis using an E. coli expression system. We reported also a combined bioinformatics and biochemical methods to predict aggregation propensity and improve protein solubilization of recombinant Gtf3. NVoy, a carbohydrate-based polymer reagent, was added to prevent protein aggregation by binding to hydrophobic protein surfaces of Gtf3. Using intrinsic tryptophan fluorescence quenching experiments, we also demonstrated that Gtf3-NVoy enzyme interacted with TDP and UDP nucleotide ligands. This case report proposes useful tools for the study of other glycosyltransferases which are rather difficult to characterize and crystallize.
Electronic supplementary material
The online version of this article (10.1007/s13205-020-02431-x) contains supplementary material, which is available to authorized users.
Keywords: Glycosyltransferase, Expression and purification of recombinant protein, Protein solubilization, Mycobacterium smegmatis
Introduction
During the last 4 decades, the number of recombinant proteins used for several academic, medical, and industrial applications has increased dramatically (Warne and Mahler 2018). This engineering field has been growing essentially due to considerable progress in available sequenced genomes, and to biotechnology and strategy developments in achieving high-level protein expression. It ranges from expression vector design to final application (Vandermies and Fickers 2019; Kushwaha and Salis 2015; Rosano and Ceccarelli 2014), during which several obstacles may be encountered. Some problems are related to intrinsic physicochemical features such as protein conformation, stability, and structural flexibility, and others related to experimental procedures such as expression and purification (Deller et al. 2016; Young et al. 2012). Nevertheless, protein structure prediction tools have presently become sufficiently robust to provide valuable insight into the structures, even with uncrystallized proteins (Thayer 2016). Because some insoluble proteins contain residues that decrease their solubility (aggregation hotspots), several new methods were developed to predict hotspots and hydrophobic patches without a crystal structure, with the goal of solubilizing these expressed proteins (Matsui et al. 2017). The case study concerns the glycosyltransferase from Mycobacterium smegmatis, Gtf3. Gtf3 gene belongs to glycopeptidolipids (GPLs) biosynthetic locus containing three ORFs, Gtf1, Gtf2, and Gtf3 (Jeevarajah et al. 2002). Gtf3 enzyme performs a key step in the biosynthesis of triglycosylated forms of GPLs (Jeevarajah et al. 2002; Billman-Jacobe 2004; Deshayes et al. 2005; Mukherjee and Chatterji 2005). GPLs are found in outer layers of the mycobacterial cell wall. They are produced by nontuberculous mycobacteria (Brennan and Crick 2007; Schorey and Sweet 2008). Furthermore, several physiological processes are affected by the presence or lack of GPLs in the mycobacterial cell wall, such as motility or biofilm formation, host–pathogen interactions, intracellular survival strategies, and virulence. This ultimately influences the clinical outcomes and the disease manifestations (Gutiérrez et al. 2018). GTs catalyze glycosylation reactions involving the transfer of a glycosyl group from an activated sugar moiety (NDP donor) onto a broad variety of acceptor molecules (proteins, lipids, nucleic acids, or oligosaccharides) (Lairson et al. 2008). Functionally, GTs are subdivided into retaining or inverting enzymes according to the stereochemistry of the substrates and products (Schuman et al. 2006). Structurally, GTs adopt one of the three folds, termed GT-A, GT-B, and GT-C. GT-B enzymes comprise two β/α/β Rossmann-like domains that face each other. Between this domains is located the active site contaning residues which are involved in leaving group departure. Generally, the reaction catalyzed by these enzymes is metal ion independant (Schmid et al. 2016). Triglycosylated GPLs result from the addition of an extra rhamnosyl residue. Moreover, the function of Gtf3 gene was not precisely determined, although genetic studies reported that gtf3 is involved in adding the 3,4-di-O-methyl-rhamnose to the terminal 3,4-di-O-methyl rhamnose and it was also involved in adding 3-O-Me-Rhamnose (Deshayes et al. 2005; Miyamoto et al. 2006). Gtf3 enzyme belongs to the CAZy GT1 superfamily, sharing characteristics of the GT-B structural fold and inverting catalytic mechanism (Lairson et al. 2008). Herein are presented a combined bioinformatics and biochemical methods to predict aggregation possibility and improve solubilization of expressed Gtf3.
Materials and methods
Bioinformatics study
Hydrophobic cluster analysis (HCA)
Putative glycosyltransferase, Gtf3 from Mycobacterium smegmatis MC2 155 strain (gi|23345078), belongs to the glycosytransferase class (GTs; EC 2.4) and GT1 family according to Carbohydrate Active Enzyme (CAZy) Database classification (Lombard et al. 2014). Enzyme classification is based on amino acid sequence similarities (www.cazy.org/). Hydrophobic Clusters Analysis (HCA) was performed on Gtf3 using MeDor program (Lieutaud et al. 2008).
Prediction of secondary structures
Secondary structures of Gtf3 were predicted with Phyre2 web server (www.sbg.bio.ic.ac.uk/phyre2/html/page.cgi?id=index) which uses a protein remote homology detection methods to build three-dimensional models (Kelley et al. 2015). The resulting model of Gtf3 was submitted to molecular visualization system, Pymol (Bramucci et al. 2012), to predict the position of cysteine residues.
Prediction of oligomeric state
Oligomeric state of Gtf3 was predicted using web servers ROBETTA (new.robetta.org) and SWISS-MODEL (swissmodel.expasy.org). These programs predict the homo-oligomer structure of protein of interest from an amino acid sequence (Kim et al. 2004; DiMaio et al. 2011; Biasini et al. 2014).
Multiple alignment
Characterized rhamnosyltransferase sequences from the CAZy GT1 superfamily (https://www.cazy.org/GT1_characterized.html) related to Gtf3 protein sequence were retrieved from National Center for Biotechnology Information (NCBI) database using BLAST program. Multiple alignments of these amino acid sequences were generated using the CLUSTALW software with default parameters and visualized by Bioedit program.
Biochemical study
Expression of the recombinant protein
The Gtf3 gene was cloned into pDESTTM17 expression vector (Invitrogen) in frame with a sequence coding for an N-terminal polyhistidine tag (His-tag). E. coli Rosetta™ (DE3) pLysS competent cells (Novagen) were transformed by heat shock with 10 ng/µl of plasmid DNA carrying ampicillin and chloramphenicol resistance genes in addition to Gtf3. Transformed bacteria were precultured overnight at 37 °C with shaking (220 rpm) in 300 ml of LB Broth Miller growth medium (Fisher Scientific) supplemented with antibiotics ampicillin (100 μg/ml) and chloramphenicol (34 μg/ml). 60 ml of the saturated culture were then transferred into 6 L of Super Broth medium, which contains per liter: 32 g tryptone, 20 g yeast extract, 5 g NaCl, and 5 ml 1 N NaOH, and cultured at 37 °C with shaking (220 rpm) up to an optical density (OD 600 nm) of 0.8 prior to induction with 0.5 mM of isopropyl-β-D-thiogalactopyranoside (IPTG). After 4 h of incubation at 30 °C and shaking (220 rpm), cells were harvested by centrifugation at 4000 rpm for 30 min at 4 °C. Pellets were resuspended in 200 ml of lysis buffer (containing 50 mM Tris pH7.5, 10 mM imidazole, 150 mM NaCl, 5 mM β-mercaptoethanol, 0.25 mg/ml lysozyme, 0.1% Tween 20, and 20. 5% glycerol) and incubated in the presence of DNAse (10 μg/ml) for 30 min under gentle shaking at 4 °C and then sonicated on ice for 5 min. Cell debris were pelleted and discarded after 30 min centrifugation at 14,000 rpm at 4 °C. Supernatants containing the soluble proteins were filtered through 0.45 μM Durapore filters (Millipore) and kept on ice for further steps.
Protein purification
The recombinant protein Gtf3 present in the supernatant was purified under native conditions using Akta Xpress fast protein liquid chromatography (Amersham, Biosciences). Firstly, filtered supernatant was loaded onto a His-Trap HP 5-ml column (GE Healthcare, Cat. No. 17–5248-02) which was equilibrated with Buffer A (50 mM Tris pH 7.5, 10 mM imidazole, 150 mM NaCl, and 5 mM β-mercaptoethanol) at a flow rate of 1 ml.min−1 (Ren et al. 2013). After protein binding, the column was washed with 10 column volumes (CVs) of Buffer A prior to elution with Buffer B (50 mM Tris pH 7.5, 500 mM imidazole, 150 mM NaCl, and 5 mM β-mercaptoethanol). Peak fractions containing the His-tagged recombinant Gtf3 protein were selected based on the profile obtained by SDS-PAGE, and were then pooled. The protein concentration was estimated at 280 nm using a NanoDrop™ 1000 spectrophotometer (Thermo Fisher Scientific). Pooled fractions of Gtf3 (46 kDa) were dialyzed against buffer containing 50 mM Tris pH 7.5, 150 mM NaCl, and 5 mM DTT, overnight at 4 °C in appropriate dialysis cassette and then concentrated to a final volume of 6 ml using a centrifugal concentrator, Centricon of 30 kDa cut-off (Amicon). Recombinant Gtf3 was further purified by size exclusion chromatography (SEC). 6 ml of protein sample was loaded onto a HiLoad 26/60 Superdex 75 pg (GE Healthcare) column at a flow rate of 1.5 ml min−1, which was equilibrated with a buffer containing 50 mM Tris pH 7.5, 150 mM NaCl, and 5 mM of reducing agent, DTT (dithiothreitol) (Ren et al. 2013). Purified Gtf3 protein (46 kDa) was collected and concentrated using Centricon of 30 kDa cut-off (Amicon), and its concentration determined using a NanoDrop™ 1000 spectrophotometer (Thermo Fisher Scientific). The purity of Gtf3 protein was assessed by SDS-PAGE, and the identity of each band was confirmed by mass spectrometry (MS).
Solubilization of protein aggregates
A linear carbohydrate-based polymer of 5 kDa named NVoy (or NV10) was prepared in line with the manufacturer’s instructions (Expedeon) (Guild et al. 2011). Purified Gtf3 was mixed with fivefold mass excess of NVoy (e.g., 1 mg/ml protein with 5 mg/ml polymer) and transferred into microdialysis cassette (Thermo Fisher Scientific). To determine the optimal condition for Gtf3 solubilization, several buffers at different pH and salt concentrations were screened for the dialysis step (Table 1). Absorbance of each Gtf3-containing buffer was measured at 340 nm using a Varian Cary Scan 50 spectrophotometer to assess the degree of protein solubilization. OD340 was used to measure light scattering and thus to estimate the precipitation.
Table 1.
Optimization of Gtf3 solubilization
| pH | Buffer | Ionic strength | Polymer |
|---|---|---|---|
| 6 | 10 mM MES | 50. 100 or 150 mM NaCl | Fivefold mass excess of NVoy |
| 6.5 | 10 mM sodium phosphate | ||
| 7 | 10 mM MOPS | ||
| 7.5 | 10 mM Tris | ||
| 10 mM HEPES | |||
| 8.5 | 10 mM imidazole | ||
| 10 mM Bicine | |||
| 9 | 10 mM CHES |
SDS-PAGE
Purified protein profile of Gtf3 was obtained according to the method of Laemmli (Laemmli 1970). Fractions were loaded onto a 12% polyacrylamide gel. Gel electrophoresis was run at 300 V for 15 min with Mini-PROTEAN II (Bio-Rad). Gels were subsequently stained with Coomassie R250 (Thermo scientific) and the image was captured using a ImageQuant TL software (GE Healthcare) based on densometric parameters scan (GE Healthcare) (Ali et al. 2012). Molecular weights of the protein bands were calculated based on the molecular weight marker (Bio-Rad).
In-gel digestion and mass spectrometry analysis (MS)
Protein gel bands of interest were excised and then digested overnight at 37 °C by 12.5 μg/ml of trypsin (Promega) in 50 mM ammonium bicarbonate (NH4HCO3) (Sigma). The peptides were extracted with 25 mM ammonium bicarbonate for 15 min, dehydrated with acetonitrile (ACN) (Sigma), and incubated with 5% formic acid (Aldrich) with shaking for 15 min. Drying of samples was performed again with ACN was accomplished via vacuum centrifugation (Ali et al. 2012). The pellets were resuspended in formic acid/acetonitrile/H2O (volume proportion, 35/50/15%). 1 µl of the peptides suspension was mixed 3 µl of 2, 5-dihydroxybenzoic acid (DHB) matrix and spotted onto the MALDI-TOF target. The air-dried samples were then analyzed on an MALDI-TOF MS (Bruker Daltonics) for identification.
Multiangle Static Light Scattering (MALS)/refractometry characterization
The integrity and quaternary structures of purified Gtf3 with and without NVoy polymer were analyzed by the combination of UV spectrophotometry, multiangle static light scattering (MALS), and refractometry, coupled on-line with an analytical size exclusion chromatography (SEC) column. Analytical SEC was carried with an HPLC Alliance 2695 system (Waters) on a 15-ml KW-804 column (Shodex) at a flow rate of 0.5 ml.min−1, UV absorbance was detected using photodiode array detector (2996; Waters), MALS detection was performed using a MiniDawn Treos (Wyatt Technology), and refractometry measurement was achieved with a differential refractometer (Optilab rEX; Wyatt Technology) (Veesler et al. 2009). Indeed, multiangle static light scattering (MALS) measures the absolute molecular weight of injected sample and is connected to a Quasi-Elastic Light scattering detector (QELS/DLS), Dynapro Wyatt, for the measurement of hydrodynamic radius (Rh). These two detectors are coupled to an HPLC (High-Performance Liquid Chromatography) system that comprises two main types of detectors, a UV–visible detector that measures the light absorption by the sample at the exit of the column and a differential refractometer. Optilab rEX Wyatt measures the variation of the refractive index (RI) of the solution at the exit of the column, which allows determining of the protein sample concentration in a similar manner with the UV–visible detector. To compare the oligomerization status of the Gtf3 purified protein and Gtf3 with and without NVoy polymer, 30 μl of each sample at a concentration of 8.46 mg/ml and 3.81 mg/ml were injected onto the KW804 column (Shodex). Before both MALS and CD measurements, samples were filtered through 0.22 µm pore size Millex syringe filter (Millipore Corp) and used buffers were identical to gel filtration buffer (see above). The oligomery of Gtf3 was calculated using the software program provided by the manufacturer.
Circular dichroism (CD)
The CD spectrum was recorded on a Jasco J-180 spectropolarimeter, deconvolved using CDNN CD spectra software. In addition, the percentages of β-strand, α-helix, turns, and random coils of Gtf3 protein were determined by the CDNN CD spectra software. CD spectra of purified (final concentration 0.2 mg/ml) and solubilized Gtf3 (in 300 µl of a buffer containing 20 mM HEPES pH 7.5, 150 mM NaCl, and 5 mM β-mercaptoethanol) were achieved at 20 °C in the wavelength range of 190–260 nm. Data processing was done with the Dichroweb software (https://dichroweb.cryst.bbk.ac.uk/html/home.shtml) (Vincentelli et al. 2004).
Crystallogenesis
The purpose of the screening of crystallization conditions is to determine all the physical conditions (temperature, volume of the drop, reservoir, etc.) and chemical conditions (protein concentration, type and concentration of precipitating agent, pH, etc.), that will induce the formation of some crystalline nuclei, and then their growth. We carried out a screening by nanodroplet method using the 20 °C vapor diffusion technique (Sulzenbacher et al. 2002). For this purpose, we used GREINER 96-well crystallization plates (Greiner Bio-one), containing three drop wells per reservoir well at volumes of 100, 200, and 300 nl for each condition. Greiner plate reservoirs were filled with a TECAN robot and dispensing nanoliter droplets was performed by a Cartesian robot (Dolzan et al. 2004). The Wizard Screen I (Emerald Bio-Structures), Stura, and MDL commercial kits were used for screening of Gtf3 crystallization conditions with NVoy polymer. This crystallogenesis method using nano-drop robotics was previously described by Sulzenbacher et al. (Sulzenbacher et al. 2002).
Ligand-binding essay
The ligand-binding assay have been performed using quenching of intrinsic tryptophan fluorescence emission of Gtf3 protein with NVoy polymer and its potentiel nucleotide ligands (TDP, GDP, UDP, and ADP). Fluorescence experiments were carried out on Cary Eclipse spectrofluorimeter (Varian). Fluorescence intensity of Gtf3-NVoy (concentration 0.15 µM) in the buffer containing 50 mM Tris pH 7.5, 150 mM NaCl, 5 mM β-mercaptoethanol was titrated and under the same conditions in the presence of increasing concentrations of nucleotide ligands (0–50 µM). The excitation wavelength was 280 nm and the emission spectra were recorded in the range of 300–420 nm. Each spectrum was the average of three acquisitions and was corrected for the contribution of the experimental solution without protein sample. The dissociation constants (KD) values were estimated by non-linear regression using Prism 3.02 (GraphPad software, Inc).
Results
Bioinformatics study
Hydrophobic Cluster Analysis (HCA)
Medor program is used mainly to identify, from the protein primary sequence, the two-dimensional folding signatures (secondary structures), and also to visualize structured, non-structured, and/or poorly structured globular regions in the protein. In addition, it gives the analysis of hydrophobic clusters. Hydrophobic clusters of Gtf3 are distributed along the protein sequence (Fig. S1). These hydrophobic clusters are derived from the formation of secondary structures, α-helix and β-sheets. Although hydrophobic amino acids (V, I, L, M, Y, W, and F) belong mainly to regular secondary structures and participate to the densely packed cores of globular domains, some proteins have exposed hydrophobic patches, which are stabilized by interactions (i.e., either with partner proteins or to form oligomers) (Bitard‐Feildel et al. 2018). Among 422 amino acids of the full-length Gtf3 protein, 130 amino acids are hydrophobic (30%). Furthermore, based on known protein structures sharing sequence similarities with Gtf3, the prediction of secondary structures performed by the Phyre2 program showed that there are probably also hydrophobic patches on the surface of Gtf3 protein that can generate intermolecular interactions and form aggregates (Fig. 1a, b). Altogether, the high percentage of hydrophobic residues of the sequence and the significant hydrophobic patches on the surface of Gtf3 predict likely an aggregation propensity and a low solubilization of this protein when overexpressed.
Fig. 1.

Secondary structure prediction of Gtf3 protein. The protein structure prediction was performed using Phyre2 web server and visualized using Pymol 2.3 molecular graphics software. a Secondary structure prediction of Gtf3 protein showing α-helix (red), β-sheets (yellow), and loops (green). b Surface of the Gtf3 model predicted by the Phyre2 showing hydrophobic patches (orange regions)
Prediction of secondary structures
The top ranking structural model of Gtf3 found by Phyre2 is Vancosaminyltransferase GtfD of Amycolatopsis orientalis (PDB code: 1rrv) with 100.0% of confidence and 22% of sequence identity. The result of this predicted model shows the presence of secondary structures mainly α-helix and β-sheets (Fig. 1a). The primary sequence of Gtf3 protein contains 6 cysteines of which 4 are on the surface and exposed to the solvent according to Phyre2 prediction. The presence of exposed cysteine residues may lead to intermolecular disulfide bridges, requiring the usage of reducing agents, such as β-mercaptoethanol and DTT (dithiothreitol) throughout expression, purification, and biochemical characterization of Gtf3 to prevent its aggregation.
Prediction of oligomeric state
Sequence analysis using ROBETTA and SWISS-MODEL web servers predicted Gtf3 to be a monomeric protein. The top ranking structural model found in this prediction was glycosyltransferase GtfA from Actinoplanes teichomyceticus and Amycolatopsis orientalis (PDB code: 3H4I) with 30.42% of sequence identity and 90% of sequence coverage.
Multiple alignment
Multiple sequence alignment analysis has been achieved with Gtf3 homologs from GT1 superfamily (CAZy classification) which have been characterized to have a rhamonsyltransferases activity (Fig. S2). This analysis revealed the existence of fairly conserved motif (HHxxAG) among GTs sequences and was superimposed on the motif of the closest model to Gtf3 protein according to Phyre2 secondary structure prediction program which is HHxxAGT. In the structural model, this motif has been reported to be localized in a loop between the domains and is involved in the interaction with the donor nucleotide-sugar, TDP-epi-vancosamine (GtfA) (Mulichak et al. 2003). Therefore, the conserved motif can interact with the nucleotide diphosphate of the donor substrate of Gtf3 to NDP-3,4-di-O-Me-Rhamnose and NDP-3-O-Me-Rhamnose. Furthermore, another motif G(T/S)RGD was highly conserved throughout the rhamonsyltransferases sequences and was suggested to be the potential catalytic base in GtfD enzyme (Chen et al. 2009). Multiple sequence alignment revealed also that Asp 348 was the negatively charged residue which was highly conserved among these sequences of the same family. This residue could be involved in the inversion catalytic mechanism by a nucleophilic attack at the binding site to the acceptor substrate of the Gtf3 N-terminal domain. Absolutely conserved hydrophobic residues have been identified, Leu 24, Gly 337, Pro 339, Leu 341, and Gly 362, which could have a structural role in the active site of Gtf3 enzyme and/or in protein oligomerization.
Protein expression and purification
As indicated in Fig. 2, the recombinant Gtf3 protein was overexpressed and detected in both insoluble and soluble fractions. Then, it was purified by His-Trap HP 5-ml column affinity chromatography followed by size exclusion chromatography (SEC). The SEC chromatogram showed two peaks, corresponding to proteins eluted at 113 ml, which is the void volume (V0) and 170 ml, as shown by the elution profile (Fig. 3). Fractions containing proteins were separated and analyzed by SDS-PAGE (Fig. 4a). We used ExPASy server to compute the theoretical isoelectric point (pI) and molecular weight (MW) of recombinant Gtf3, which are 5.96 and 46.02 kDa, respectively. SDS-PAGE displayed abundant protein bands with apparent MW of 46 kDa, corresponding to the calculated mass of recombinant Gtf3. Abundant protein bands were excised from the gel and submitted to mass spectrometry (MS) analysis, confirming that the detected protein corresponds to Gtf3. This result demonstrates that both first and second peaks of gel filtration (Fig. 3) contain Gtf3. The first peak being eluted in the void volume, means that Gtf3 in this peak is highly aggregated. The second peak corresponds to a mass of 275 kDa as compared to gel filtration calibration (Fig. 4b, c), which is approximately equivalent to six fold the mass of Gtf3 (6 × 46 kDa = 276 kDa). Therefore, Gtf3 is very likely a hexamer at the outlet of gel filtration with a low proportion of aggregates. This result is consistent with Hydrophobic Cluster Analysis prediction. The quantity of produced Gtf3 was estimated using a NanoDrop™ 1000 spectrophotometer (Thermo Fisher Scientific) and yielded 3.15 mg/ml. Our results indicate that our expression system is functional, although it might need further optimization, but it is not our focus in this study. Protein profiles were analyzed using ImageQuant™ TL software to determine the relative abundance of each band. The purity of Gtf3 in the different fractions was greater than 90%, and was considered sufficiently pure for downstream biochemical characterization (Table 2).
Fig. 2.
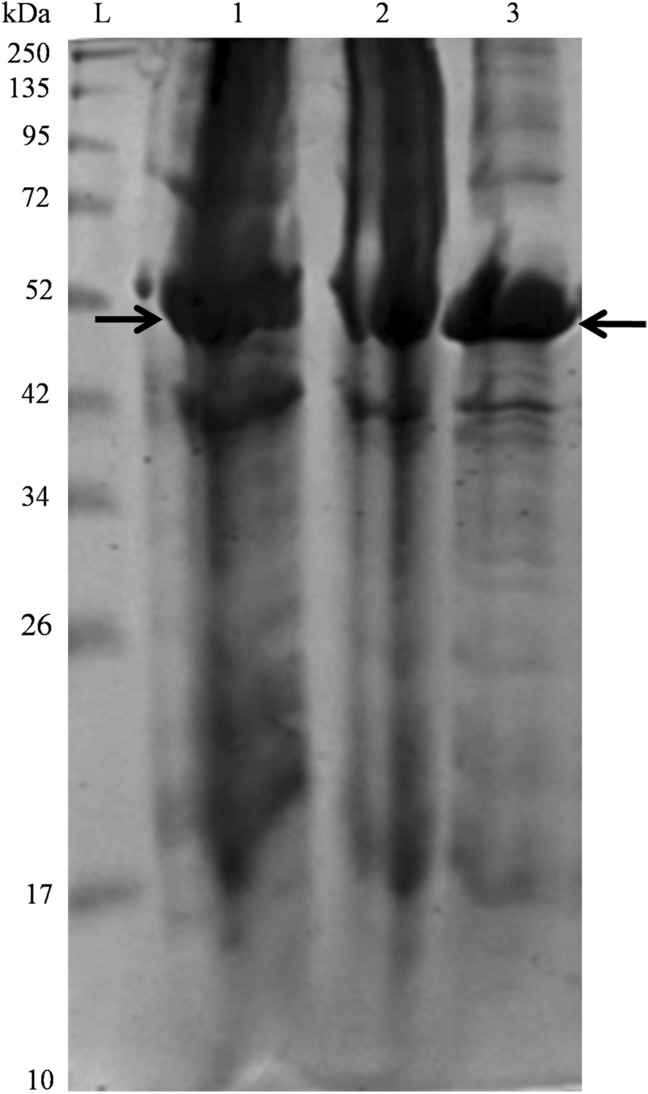
SDS-PAGE gel of expressed and purified recombinant Gtf3 protein. Gtf3 recombinant protein samples from M. smegmatis expressed in E. coli expression system and purified by affinity chromatography were separated on 12% SDS-PAGE and post-stained with Imperial™ Protein Stain (Thermo Scientific). Lane L, molecular weight marker (BenchMark™ Protein Ladder). Lane 1, insoluble fraction (pellet). Lane 2, soluble fraction (supernatant). Lane 3, the recombinant Gtf3 purified by His-Trap HP 5-ml column affinity chromatography. Arrows show Gtf3 protein bands in insoluble fraction and pure fraction
Fig. 3.

Gel filtration chromatography elution profile of Gtf3 protein. Gel filtration of Gtf3 on a HiLoad 26/60 Superdex 75 pg column. The first peak (fractions A2–A8) represents the aggregated protein and the second peak (fractions B6–D6) hexameric Gtf3. Elution volume of Gtf3 protein was 170 ml
Fig. 4.

a SDS-PAGE gel of purified recombinant Gtf3 protein stained with Coomassie blue. Gtf3 purified by both affinity and gel filtration chromatographies, were separated on 12% SDS-PAGE and post-stained with Imperial™ Protein Stain (Thermo Scientific). Five microliter of each collected fraction were loaded per well. Lane L, molecular weight marker (Pierce Unstained Protein MW Ladder). Other wells, peak fractions (Lanes 1–9) collected from gel filtration chromatography. Lane 1 corresponds to pooled fractions from the first peak. Lane 2 corresponds to pooled fractions (A9-B5) between the first and the second peaks. Lanes 3–9 correspond to fractions from the second peak. MW: molecular weight. kDa: kiloDalton. b Calibration of gel filtration column. Protein standards of known molecular weight were used to calibrate the 26/60 Superdex 75 pg gel filtration column, i.e., blue dextran (2000 kDa; peak 1), albumin (67 kDa; peak 2), ovalbumin (43 kDa peak 3), chymotrypsinogen (25 kDa; peak 4) and ribonuclease A (13.7 kDa; peak 5). c Linear regression analysis of the gel filtration calibration. Kav = (Ve–Vo)/(VT–Vo), Ve is the elution volume, and VT and Vo are the total liquid volume (320 ml) and the void volume of the column (113 ml), respectively
Table 2.
Purification table of Gtf3
| Purification | Concentration (mg/ml) | Quantity (mg) | Purity (%) |
|---|---|---|---|
| After affinity chromatography | 30.4 | 13.9 | 70 |
| After size exclusion chromatography | 3.15 | 6.89 | 95 |
Secondary structure of Gtf3
We wanted to confirm bioinformatics prediction and quality of the purified Gtf3, so we performed circular dichroism spectroscopy (CD) analysis. The experimental spectrum is typical of a protein organized into β-sheets (largely negative ellipticity between 216 and 222 nm) and α-helixes (positive ellipticity between 180 and 200 nm) with a more or less noisy spectrum in this measurement range; these results are compared to the CD reference spectrum (Fig. 5). This result seems to be in agreement with the predictions of secondary structures.
Fig. 5.

Circular dichroism (CD) spectrum of Gtf3 protein
To determine the proportion of each type of secondary structure, the experimental spectrum was analyzed in its elementary components and deconvoluted with the Dichroweb software. The CD results showed 49% of α-helix, 25% of β-sheets, 8% of loops, and 20% of disordered structures. This CD experimental result was also in agreement with the Phyre2 secondary structure prediction (Fig. S1 and Fig. 1).
Oligomerization status of Gtf3
Both in silico prediction and the SEC result showed a tendency of Gtf3 to aggregate, although the protein keeps its folding integrity. To prevent this aggregation, we mixed purified Gtf3 with NVoy (with fivefold mass excess than Gtf3). This latter is a long polymer of 5 kDa, which has been shown to bind surface hydrophobic regions of target proteins and prevent the aggregation without affecting their active site (Klammt et al. 2011). In addition, we screened several buffers with different pH and salt concentrations, in the presence of NVoy, to optimize solubilization of Gtf3 prior to analysis (Supplementary Material, Table S1 and S2). The selected and used buffer in expression, purification, and biochemical characterization experiments of Gtf3 was (Tris pH 7.5 and 150 mM NaCl). SEC-MALS (Size Exclusion Chromatography coupled to MultiAngle static Light Scattering) analysis allowed us to measure the masses of the Gtf3 protein coupled to NVoy polymer (Fig. 6). Gtf3 in absence of NVoy displayed the mass of 230 kDa, corresponding likely to pentameric protein. This result is different to that obtained by size exclusion chromatography (SEC) in which the aggregate of Gtf3 was a hexamer (Fig. 3). This discrepancy is due to protein properties (e.g., geometry) and molecules in the buffer (e.g., salt concentration) may interfere with determining the real molecular weight. For instance, a fibrillar protein (elongated shape) and a globular protein of the same mass will not behave the same way through the column (Breton et al. 2006; Burgess 2018). However, in the presence of NVoy, Gtf3 had the molecular weight of 92.77 kDa. This molecular weight is unlikely a dimer (2 × 46 kDa) because of the presence of NVoy. Thus, it is likely a monomer with nine molecules of NVoy polymer (46 + 5 × 9 kDa). In addition, this result is in accordance with the oligomeric state prediction.
Fig. 6.

MALS/UV/refractometry/SEC analysis of Gtf3 protein using a KW-804 column. The left y-axis represents the molar mass, and the right y-axis represents the absorbance at 280 nm according to the retention volume of the column (x-axis). The colored plots represent the measured molecular weights of pentameric Gtf3 (red line), monomeric Gtf3 + NVoy (blue line). Values of the measured masses at the volume corresponding to the base of each peak are reported according to the same color scheme
Crystallogenesis
We performed the crystallization tests of Gtf3, purified in the presence of NVoy, at a concentration of 10.61 mg/ml. Gtf3 complexed with the NVoy polymer formed small and rod-shaped crystals. They were obtained at a concentration of 8.23 mg/ml in a solution of the wizard kit of 2.5 M NaCl, 0.1 M Tris pH7 and 0.2 MgCl2 (Fig. 7). Our result indicates that, in addition to being highly beneficial in preventing aggregates, NVoy is not interfering with crystallogenesis steps. Moreover, obtaining crystals of Gtf3 in the presence of NVoy confirms the MALS results, indicating that NVoy polymer contributes to stabilizing Gtf3 protein in monomeric form which is monodisperse in crystallization buffer solution. The identity of dissolved crystals of Gtf3 protein with NVoy polymer was verified by mass spectrometry (MS). To obtain larger crystals, we optimized crystallization conditions by varying pH values and concentration of the precipitating agent. However, we were unable to have better results.
Fig. 7.
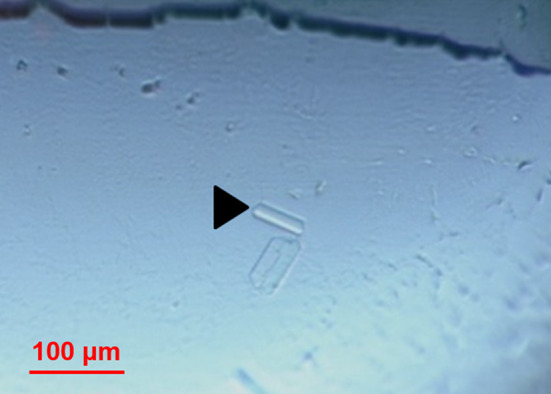
Crystals of Gtf3 protein. Crystals of Gtf3 with NVoy polymer in a drop of crystallization plates (Greiner Bio-one), obtained under the conditions: 2.5 M NaCl, 0.1 M Tris pH 7, and 0.2 M MgCl2
Ligand-binding essay
Gtf3 protein sequence contains 11 Trp residues (W68, W71, W76, W96, W142, W166, W169, W219, W247, W344, and W352). Obviously, each of these residues will be affected or not differently depending upon their accessibility, and thus contributing independently to the inherent fluorescence intensity of Gtf3 protein. Analysis of experimental Trp fluorescence quenching data showed that the intrinsic fluorescence of Gtf3-NVoy decreased upon increasing the concentration of only TDP and UDP nucleotides (Fig. 8). This shows an interaction between nucleotide ligands TDP and UDP and tryptophans of the Gtf3 protein with relatively high affinity with low KD (dissociation constant) values, 0.004 and 0.01 µM, respectively. Whereas, there was no observation of interaction of Gtf3 enzyme with the other nucleotide ligands (GDP and ADP). The ligand-binding essay result indicated that Gtf3 enzyme was active in the presence of NVoy polymer. This experimental result is in accordance with bioinformatics modeling result, because of the top ranked model of Gtf3 protein (see above), which was vancosaminyltransferase GtfD from Amycolatopsis orientalis (PDB code: 1rrv) had a UDP-glucosyltransferase activity (Mulichak et al. 2001).
Fig. 8.

Nucleotide quenching of intrinsic Gtf3 fluorescence. a Fluorescence quenching of Gtf3-NVoy with increasing concentrations of TDP. b Fluorescence quenching of Gtf3-NVoy with increasing concentrations of UDP. The first black spectrum at the top represents the intensity of fluorescence of Gtf3 without ligand. The other colored spectra, from top to bottom, represent the intensities of fluorescence of increasing concentrations of ligands. The gray spectrum at the bottom represents the intensity of fluorecsence of the buffer (blank)
Discussion
In the present study, Gtf3 from Mycobacterium smegmatis was expressed using E. coli expression system. Expressed recombinant Gtf3 protein was more abundant in the insoluble fraction than in the soluble fraction (Fig. 2). In addition, Gtf3 protein has a great tendency to aggregate. Indeed, one of the contributing factors to protein aggregation is the interaction of the exposed hydrophobic patches. We, therefore, chose to investigate the use of the NVoy polymer on expression of Gtf3 in E. coli. Moreover, NVoy polymer was observed not to block the synthesis and to favor solubility of recombinant expressed proteins in the reaction mixture of wheat germ cell-free expression system (Guild et al. 2011). This polymer was added to the purified Gtf3, because the protein of interest, tends to aggregate and form an oligomeric aggregate. This was predicted by hydrophobic cluster analysis (presence of hydrophobic patches). This tendency has also been shown by the biochemical characterization of the oligomerization state. The experimental characterization by SEC and MALS allowed to reveal that the expressed recombinant protein Gtf3 alone in E. coli was an oligomer and that NVoy polymer dissociated the oligomer into monomer. This was in agreement with the prediction of oligomeric state. Nonetheless, further experiments are needed to determine the Gtf3/NVoy ratio. The result indicates that NVoy helps to solubilize and stabilize Gtf3 in monomeric form unlike the pentamer/hexamer form obtained in the absence of NVoy. Altogether, our result suggests that NVoy polymer interacts with surface exposed hydrophobic patches on the protein, thereby limiting nonspecific interactions which can cause the aggregation and dissociate the aggregate of Gtf3 protein.
Concerning GTs structures, difficulties with high-level expression, purification, and crystallization, as well as the ratio of loops vs secondary elements (which is high in GTs) hamper the resolution of crystal structure of these enzymes (Breton et al. 2006; Schmid et al. 2016). GTs have very high donor and acceptor substrate specificities and are, in general, limited to the establishment of one glycosidic linkage. In addition, interactions between the sugar-nucleotide donor and a few protein residues seem to determine the specificity of the glycosyltransferases for their donor substrate. It has been reported that most of the loops, which are involved in donor substrate binding, are highly flexible and induce conformational changes (open and closed active conformations) (Qasba et al. 2005). This feature leads to a low electron density, thus limiting the detailed description of the catalytic domains (Schmid et al. 2016). Nevertheless, crystal structure of Gtf3 protein from Streptococcus parasanguinis has been reported (Zhu et al. 2011). Besides, this recombinant Gtf3 protein from S. parasanguinis was expressed, purified, and crystallized in E. coli in a soluble fraction (Zhu et al. 2013). The crystal structure of this native Gtf3 was solved in a tetrameric form sharing a structural similarities with GTs from GT4, GT5, and GT20 subfamilies (Zhu et al. 2011). Additionally, Zhu et al. have identified the key residues and domains involved in UDP- or UDP-glucose substrate binding and in Gtf3 function and oligomerization, respectively (Zhu et al. 2011). Despite the low homology between Gtf3 from M. smegmatis belonging to GT1 family and Gtf3 from S. parasanguinis belonging to non-classified GT family (CAZy classification), oligomerization status can be compared between these proteins using these biochemical quality control methods. Beside further structural studies, several important scientific questions remain unanswered in this case study and require future investigations concerning, i.e., a functional characterization. Furthermore, our result concerning ligand binding essay of Gtf3 was partially in agreement with high-throughput screening study of oleandomycin glycosyltransferase, which belongs to the same family (GT1 superfamily). This study reported that oleandomycin glycosyltransferase accepted TDP-α-D-glucose and UDP-α-D-glucose (relatively good substrates), ADP-α-D-glucose and GDP-α-D-glucose (relatively poor substrates), but not CDP-α-D-glucose (Gantt et al. 2013). Interesently, TDP was found in our result to be a good ligand for Gtf3 enzyme, which is a putative family 1 rhamnosyltransferase. This agrees with various structural studies on rhamnosyltransferases (Isiorho et al. 2012, 2014; Sengoku et al. 2018; He et al. 2019; Mulichak et al. 2003). The putative reaction scheme of Gtf3 enzyme is presented in figure S3 and the putative reaction of Gtf3 in the biosynthetic pathway of GPLs in M. smegmatis is presented in figure S4. The result of our study will allow designing the methylated nucleotide-rhamnose donor to carry out experiments in solution, allowing determination of which rhamnose is transferred to GPLs. Furthermore, it will contribute to determine the biological function of Gtf3, and provide a better understanding of the catalytic mechanism of this enzyme.
This biochemical study includes size exclusion chromatography (SEC), circular dichroism (CD), MALS/UV/refractometry/SEC analysis, and crystallogenesis. Quality control procedures were carried out to, respectively, assess molecular weight, secondary structure, aggregation status, and homogeneity of Gtf3. In addition, these methods can be applied to any protein, which is a prerequisite in post-genomics era, dealing mainly with proteins having an unknown function. This will contribute to face the challenges related to different applications of proteins expressed in clinical, biotechnology, scientific research, and industry.
Electronic supplementary material
Below is the link to the electronic supplementary material.
Acknowledgments
We would like to thank Dr. Yves Bourne from AFMB laboratory facilities, Dr. Badreddine Douzi and Dr. Renaud Vincentelli for support in protein expression and purification, Dr. Silvia Spinelli for crystallization facilities as well as Stéphanie Blangy, and Dr. David Veesler for support in MALS/UV/refractometry/SEC.
Author contributions
MB and FV conceived and designed the experiments. MB performed the experiments. MB, LK, and FV analyzed the data. MB, LK, NMS, HM, and FV wrote the manuscript.
Funding
No funding supported.
Compliance with ethical standards
Competing interest
The authors have declared no conflict of interest.
Availability of data and material
All data and materials are available.
Contributor Information
Mahfoud Bakli, Email: mahfoud.bakli@gmail.com.
Loukmane Karim, Email: loukmane.karim@gmail.com.
Nassima Mokhtari-Soulimane, Email: nassima_amel@yahoo.fr.
Hafida Merzouk, Email: hafidamerzouk_2@hotmail.com.
Florence Vincent, Email: florence.vincent@afmb.univ-mrs.fr.
References
- Ali ZM, Bakli M, Fontaine A, Bakkali N, Hai VV, Audebert S, Boublik Y, Pagès F, Remoué F, Rogier C. Assessment of Anopheles salivary antigens as individual exposure biomarkers to species-specific malaria vector bites. Malaria J. 2012;11(1):439. doi: 10.1186/1475-2875-11-439. [DOI] [PMC free article] [PubMed] [Google Scholar]
- Biasini M, Bienert S, Waterhouse A, Arnold K, Studer G, Schmidt T, Kiefer F, Cassarino TG, Bertoni M, Bordoli L. SWISS-MODEL: modelling protein tertiary and quaternary structure using evolutionary information. Nucleic Acids Res. 2014;42(W1):W252–W258. doi: 10.1093/nar/gku340. [DOI] [PMC free article] [PubMed] [Google Scholar]
- Billman-Jacobe H (2004) Glycopeptidolipid synthesis in mycobacteria. Curr Sci 111–114
- Bitard-Feildel T, Lamiable A, Mornon JP, Callebaut I. Order in disorder as observed by the “hydrophobic cluster analysis” of protein sequences. Proteomics. 2018;18(21–22):1800054. doi: 10.1002/pmic.201800054. [DOI] [PMC free article] [PubMed] [Google Scholar]
- Bramucci E, Paiardini A, Bossa F, Pascarella S. PyMod: sequence similarity searches, multiple sequence-structure alignments, and homology modeling within PyMOL. BMC Bioinf. 2012;13(4):S2. doi: 10.1186/1471-2105-13-S4-S2. [DOI] [PMC free article] [PubMed] [Google Scholar]
- Brennan PJ, Crick DC. The cell-wall core of Mycobacterium tuberculosis in the context of drug discovery. Curr Top Med Chem. 2007;7(5):475–488. doi: 10.2174/156802607780059763. [DOI] [PubMed] [Google Scholar]
- Breton C, Šnajdrová L, Jeanneau C, Koča J, Imberty A. Structures and mechanisms of glycosyltransferases. Glycobiology. 2006;16(2):29R–37R. doi: 10.1093/glycob/cwj016. [DOI] [PubMed] [Google Scholar]
- Burgess RR. A brief practical review of size exclusion chromatography: rules of thumb, limitations, and troubleshooting. Protein Expr Purif. 2018;150:81–85. doi: 10.1016/j.pep.2018.05.007. [DOI] [PubMed] [Google Scholar]
- Chen Y-L, Chen Y-H, Lin Y-C, Tsai K-C, Chiu H-T. Functional characterization and substrate specificity of spinosyn rhamnosyltransferase by in vitro reconstitution of spinosyn biosynthetic enzymes. J Biol Chem. 2009;284(11):7352–7363. doi: 10.1074/jbc.M808441200. [DOI] [PMC free article] [PubMed] [Google Scholar]
- Deller MC, Kong L, Rupp B. Protein stability: a crystallographer's perspective. Acta Crystallogr Sect F Struct Biol Commun. 2016;72(2):72–95. doi: 10.1107/S2053230X15024619. [DOI] [PMC free article] [PubMed] [Google Scholar]
- Deshayes C, Laval F, Montrozier H, Daffe M, Etienne G, Reyrat JM. A glycosyltransferase involved in biosynthesis of triglycosylated glycopeptidolipids in Mycobacterium smegmatis: impact on surface properties. J Bacteriol. 2005;187(21):7283–7291. doi: 10.1128/JB.187.21.7283-7291.2005. [DOI] [PMC free article] [PubMed] [Google Scholar]
- DiMaio F, Leaver-Fay A, Bradley P, Baker D, André I (2011) Modeling symmetric macromolecular structures in Rosetta3. PLoS One 6 (6) [DOI] [PMC free article] [PubMed]
- Dolzan M, Johansson K, Roig-Zamboni V, Campanacci V, Tegoni M, Schneider G, Cambillau C. Crystal structure and reactivity of YbdL from Escherichia coli identify a methionine aminotransferase function. FEBS Lett. 2004;571(1–3):141–146. doi: 10.1016/j.febslet.2004.06.075. [DOI] [PubMed] [Google Scholar]
- Gantt RW, Peltier-Pain P, Singh S, Zhou M, Thorson JS. Broadening the scope of glycosyltransferase-catalyzed sugar nucleotide synthesis. Proc Natl Acad Sci USA. 2013;110(19):7648–7653. doi: 10.1073/pnas.1220220110. [DOI] [PMC free article] [PubMed] [Google Scholar]
- Guild K, Zhang Y, Stacy R, Mundt E, Benbow S, Green A, Myler PJ. Wheat germ cell-free expression system as a pathway to improve protein yield and solubility for the SSGCID pipeline. Acta Crystallogr Sect F Struct Biol Cryst Commun. 2011;67(9):1027–1031. doi: 10.1107/S1744309111032143. [DOI] [PMC free article] [PubMed] [Google Scholar]
- Gutiérrez AV, Viljoen A, Ghigo E, Herrmann J-L, Kremer L (2018) Glycopeptidolipids, a double-edged sword of the Mycobacterium abscessus complex. Front Microbiol 9 [DOI] [PMC free article] [PubMed]
- He C, Liu N, Li F, Jia X, Peng H, Liu Y, Xiao Y (2019) Complex structure of Pseudomonas aeruginosa arginine rhamnosyltransferase EarP with its acceptor elongation factor P. J Bacteriol 201 (13) [DOI] [PMC free article] [PubMed]
- Isiorho EA, Jeon B-S, Kim NH, Liu H-w, Keatinge-Clay AT. Structural studies of the spinosyn forosaminyltransferase. SpnP Biochem. 2014;53(26):4292–4301. doi: 10.1021/bi5003629. [DOI] [PMC free article] [PubMed] [Google Scholar]
- Isiorho EA, Liu H-w, Keatinge-Clay AT. Structural studies of the spinosyn rhamnosyltransferase. SpnG Biochem. 2012;51(6):1213–1222. doi: 10.1021/bi201860q. [DOI] [PMC free article] [PubMed] [Google Scholar]
- Jeevarajah D, Patterson JH, McConville MJ, Billman-Jacobe H. Modification of glycopeptidolipids by an O-methyltransferase of Mycobacterium smegmatis. Microbiology. 2002;148(10):3079–3087. doi: 10.1099/00221287-148-10-3079. [DOI] [PubMed] [Google Scholar]
- Kelley LA, Mezulis S, Yates CM, Wass MN, Sternberg MJE. The Phyre2 web portal for protein modelling, prediction and analysis. Nat Protoc. 2015;10(6):845–858. doi: 10.1038/nprot.2015.053. [DOI] [PMC free article] [PubMed] [Google Scholar]
- Kim DE, Chivian D, Baker D (2004) Protein structure prediction and analysis using the Robetta server. Nucleic Acids Res 32 (suppl_2):W526-W531 [DOI] [PMC free article] [PubMed]
- Klammt C, Perrin MH, Maslennikov I, Renault L, Krupa M, Kwiatkowski W, Stahlberg H, Vale W, Choe S. Polymer-based cell-free expression of ligand-binding family B G-protein coupled receptors without detergents. Protein Sci. 2011;20(6):1030–1041. doi: 10.1002/pro.636. [DOI] [PMC free article] [PubMed] [Google Scholar]
- Kushwaha M, Salis HM. A portable expression resource for engineering cross-species genetic circuits and pathways. Nat Commun. 2015;6:7832. doi: 10.1038/ncomms8832. [DOI] [PMC free article] [PubMed] [Google Scholar]
- Laemmli UK. Cleavage of structural proteins during the assembly of the head of bacteriophage T4. Nature. 1970;227(5259):680–685. doi: 10.1038/227680a0. [DOI] [PubMed] [Google Scholar]
- Lairson L, Henrissat B, Davies G, Withers S (2008) Glycosyltransferases: structures, functions, and mechanisms. Ann Rev Biochem 77 [DOI] [PubMed]
- Lieutaud P, Canard B, Longhi S. MeDor: a metaserver for predicting protein disorder. BMC Genom. 2008;9(2):S25. doi: 10.1186/1471-2164-9-S2-S25. [DOI] [PMC free article] [PubMed] [Google Scholar]
- Lombard V, Golaconda Ramulu H, Drula E, Coutinho PM, Henrissat B. The carbohydrate-active enzymes database (CAZy) in 2013. Nucl Acids Res. 2014;42(D1):D490–D495. doi: 10.1093/nar/gkt1178. [DOI] [PMC free article] [PubMed] [Google Scholar]
- Matsui D, Nakano S, Dadashipour M, Asano Y. Rational identification of aggregation hotspots based on secondary structure and amino acid hydrophobicity. Sci Rep. 2017;7(1):9558. doi: 10.1038/s41598-017-09749-2. [DOI] [PMC free article] [PubMed] [Google Scholar]
- Miyamoto Y, Mukai T, Nakata N, Maeda Y, Kai M, Naka T, Yano I, Makino M. Identification and characterization of the genes involved in glycosylation pathways of mycobacterial glycopeptidolipid biosynthesis. J Bacteriol. 2006;188(1):86–95. doi: 10.1128/JB.188.1.86-95.2006. [DOI] [PMC free article] [PubMed] [Google Scholar]
- Mukherjee R, Chatterji D. Evaluation of the role of sigma B in Mycobacterium smegmatis. Biochem Biophys Res Commun. 2005;338(2):964–972. doi: 10.1016/j.bbrc.2005.10.038. [DOI] [PubMed] [Google Scholar]
- Mulichak AM, Losey HC, Lu W, Wawrzak Z, Walsh CT, Garavito RM. Structure of the TDP-epi-vancosaminyltransferase GtfA from the chloroeremomycin biosynthetic pathway. Proc Natl Acad Sci. 2003;100(16):9238–9243. doi: 10.1073/pnas.1233577100. [DOI] [PMC free article] [PubMed] [Google Scholar]
- Mulichak AM, Losey HC, Walsh CT, Garavito RM. Structure of the UDP-glucosyltransferase GtfB that modifies the heptapeptide aglycone in the biosynthesis of vancomycin group antibiotics. Structure. 2001;9(7):547–557. doi: 10.1016/S0969-2126(01)00616-5. [DOI] [PubMed] [Google Scholar]
- Qasba PK, Ramakrishnan B, Boeggeman E. Substrate-induced conformational changes in glycosyltransferases. Trends Biochem Sci. 2005;30(1):53–62. doi: 10.1016/j.tibs.2004.11.005. [DOI] [PubMed] [Google Scholar]
- Ren B, Pham TM, Surjadi R, Robinson CP, Le T, Chandry P, Peat TS, McKinstry WJ. Expression, purification, crystallization and preliminary X-ray diffraction analysis of a lactococcal bacteriophage small terminase subunit. Acta Crystallogr Sect F Struct Biol Cryst Commun. 2013;69(3):275–279. doi: 10.1107/S174430911300184X. [DOI] [PMC free article] [PubMed] [Google Scholar]
- Rosano GL, Ceccarelli EA. Recombinant protein expression in Escherichia coli: advances and challenges. Front Microbiol. 2014;5:172. doi: 10.3389/fmicb.2014.00172. [DOI] [PMC free article] [PubMed] [Google Scholar]
- Schmid J, Heider D, Wendel NJ, Sperl N, Sieber V. Bacterial glycosyltransferases: challenges and opportunities of a highly diverse enzyme class toward tailoring natural products. Front Microbiol. 2016;7:182. doi: 10.3389/fmicb.2016.00182. [DOI] [PMC free article] [PubMed] [Google Scholar]
- Schorey JS, Sweet L. The mycobacterial glycopeptidolipids: structure, function, and their role in pathogenesis. Glycobiology. 2008;18(11):832–841. doi: 10.1093/glycob/cwn076. [DOI] [PMC free article] [PubMed] [Google Scholar]
- Schuman B, Alfaro JA, Evans SV (2006) Glycosyltransferase structure and function. In: Bioactive Conformation I. Springer, pp 217–257
- Sengoku T, Suzuki T, Dohmae N, Watanabe C, Honma T, Hikida Y, Yamaguchi Y, Takahashi H, Yokoyama S, Yanagisawa T. Structural basis of protein arginine rhamnosylation by glycosyltransferase EarP. Nat Chem Biol. 2018;14(4):368–374. doi: 10.1038/s41589-018-0002-y. [DOI] [PubMed] [Google Scholar]
- Sulzenbacher G, Gruez A, Roig-Zamboni V, Spinelli S, Valencia C, Pagot F, Vincentelli R, Bignon C, Salomoni A, Grisel S. A medium-throughput crystallization approach. Acta Crystallogr D Biol Crystallogr. 2002;58(12):2109–2115. doi: 10.1107/S0907444902013938. [DOI] [PubMed] [Google Scholar]
- Thayer KM. Structure prediction and analysis of neuraminidase sequence variants. Biochem Mol Biol Educ. 2016;44(4):361–376. doi: 10.1002/bmb.20963. [DOI] [PubMed] [Google Scholar]
- Vandermies M, Fickers P. Bioreactor-scale strategies for the production of recombinant protein in the yeast Yarrowia lipolytica. Microorganisms. 2019;7(2):40. doi: 10.3390/microorganisms7020040. [DOI] [PMC free article] [PubMed] [Google Scholar]
- Veesler D, Blangy S, Siponen M, Vincentelli R, Cambillau C, Sciara G. Production and biophysical characterization of the CorA transporter from Methanosarcina mazei. Anal Biochem. 2009;388(1):115–121. doi: 10.1016/j.ab.2009.02.018. [DOI] [PubMed] [Google Scholar]
- Vincentelli R, Canaan S, Campanacci V, Valencia C, Maurin D, Frassinetti F, Scappucini-Calvo L, Bourne Y, Cambillau C, Bignon C. High-throughput automated refolding screening of inclusion bodies. Protein Sci. 2004;13(10):2782–2792. doi: 10.1110/ps.04806004. [DOI] [PMC free article] [PubMed] [Google Scholar]
- Warne NW, Mahler H-C. Challenges in protein product development. New York: Springer; 2018. [Google Scholar]
- Young CL, Britton ZT, Robinson AS. Recombinant protein expression and purification: a comprehensive review of affinity tags and microbial applications. Biotechnol J. 2012;7(5):620–634. doi: 10.1002/biot.201100155. [DOI] [PubMed] [Google Scholar]
- Zhu F, Erlandsen H, Ding L, Li J, Huang Y, Zhou M, Liang X, Ma J, Wu H. Structural and functional analysis of a new subfamily of glycosyltransferases required for glycosylation of serine-rich streptococcal adhesins. J Biol Chem. 2011;286(30):27048–27057. doi: 10.1074/jbc.M110.208629. [DOI] [PMC free article] [PubMed] [Google Scholar]
- Zhu F, Wu R, Zhang H, Wu H (2013) Structural and biochemical analysis of a bacterial glycosyltransferase. In: Glycosyltransferases. Springer, pp 29–39 [DOI] [PMC free article] [PubMed]
Associated Data
This section collects any data citations, data availability statements, or supplementary materials included in this article.