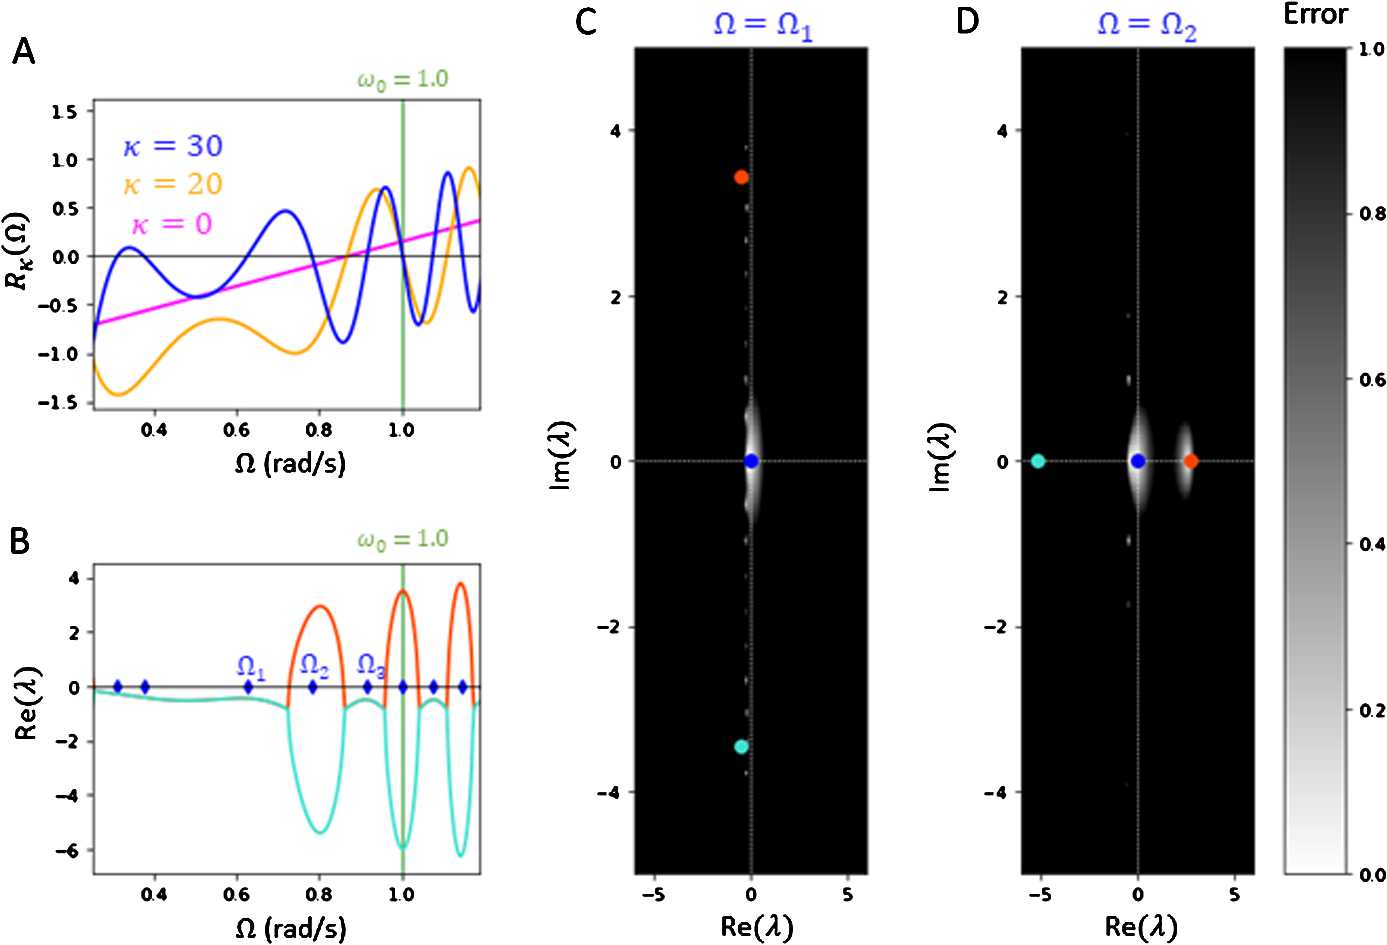
Figure 2.

Theoretical stability plots for two-oscillator system. A. Plot of error functions with varying fixed gain (magenta), (yellow), (blue). All roots of are potential synchronization frequencies for the two-oscillator system. The number of roots Ω for increase with larger κ. B. The plasticity gain is set to . Plot of the real part of the non-zero branches , (orange, cyan) of the polynomial root equation over . Ticks on the Ω-axis (blue) indicate the frequencies solving where the system can synchronize. The plotted branches imply that the oscillators will synchronize at , and avoid the unstable frequency with . C, D. Error heatmaps with , respectively, approximate the distribution of eigenvalues solving near , scaled and normalized for visibility. Spots near zero error (white) suggest potential eigenvalue locations. Markers plot the eigenvalues (blue, orange, cyan) for . The heatmap in D indicates an eigenvalue λ near , which implies instability at . All other eigenvalues λ appear to be distributed either at or on the left-side of the imaginary axis. Here, and . For all plots, , , , , and
