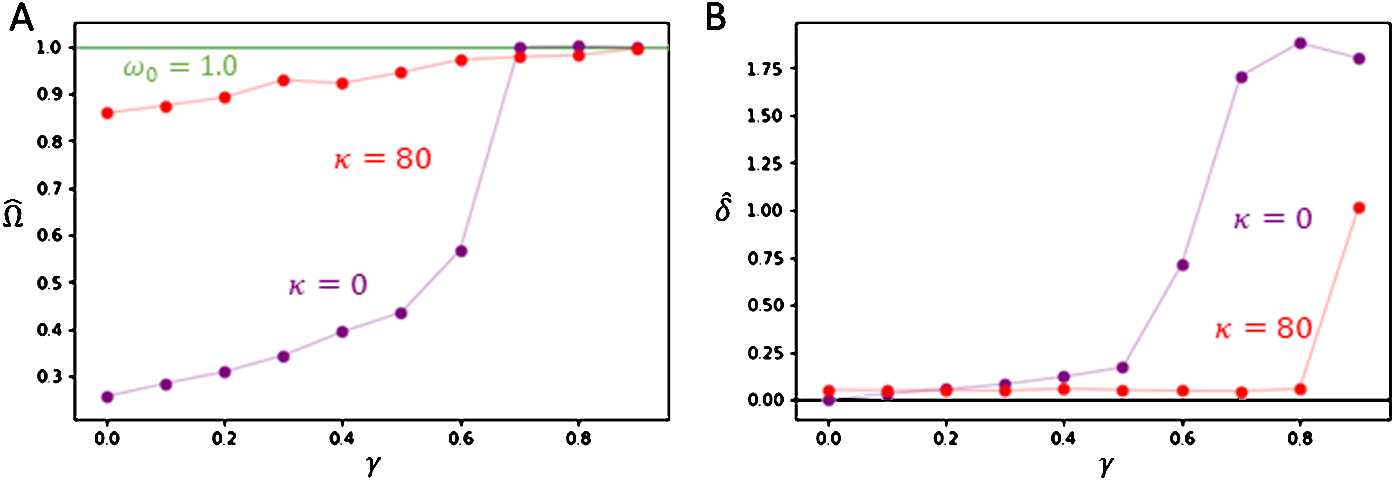
Figure 7.

Comparing of post-injury network asymptotic behaviour with increasing injury between plastic and non-plastic delays. Each numerical trial was run over 320 s, and all asymptotic values were evaluated by averaging over the final 16 s. Injury was introduced at . Both plots show trials with adaptive delays (red) and fixed delays (purple). A. Plot of post-injury asymptotic frequency Ω̂ for trials with injury . As γ increases, . B. Plot of post-injury asymptotic standard deviation δ̂ for trials with injury . As γ increases, δ̂ has significant increase for trials without plasticity, while δ̂ remains relatively small for trials with plasticity until . The parameters used were , , , , , , and
